


Author:Wall Street CN
Full text abstract
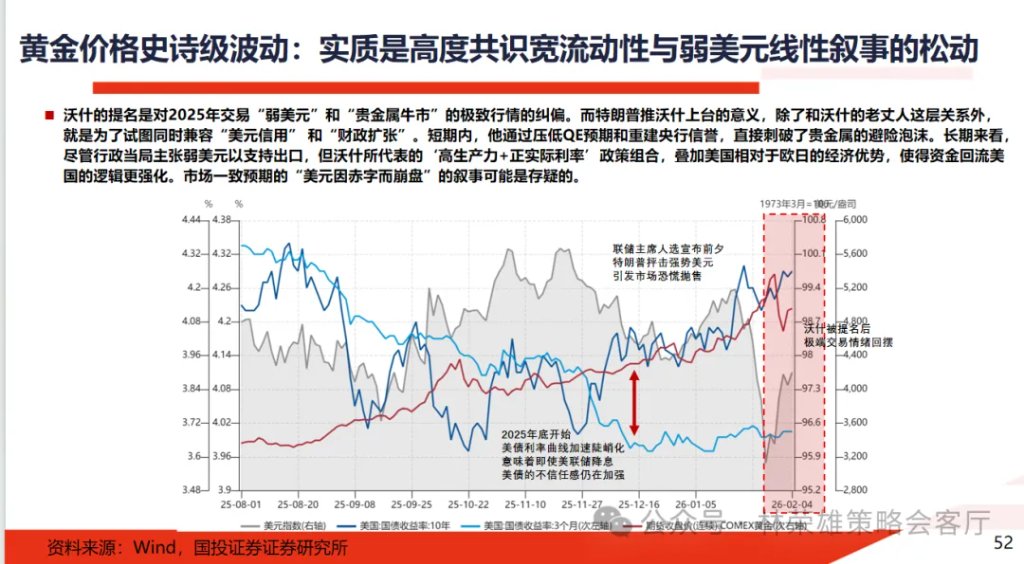
Introduction: The recent appointment of new Federal Reserve Chairman Warsh has triggered expectations of global liquidity tightening, leading to significant volatility in various assets, including precious metals. Encouragingly, the A-share market has shown strong resilience during this period, indicating that the current long-term bull market in A-shares is primarily priced in domestic factors and less affected by external marginal influences. From an internal perspective, we have consistently emphasized that "a spring rally exceeding 10% requires a clear underlying logic." The market's failure to break through 4200 points (the 10% return threshold) and subsequent short-term consolidation demonstrates that our adherence to our framework and avoidance of excessive aggressiveness has been accurate. Now that the significant outflows from broad-based ETFs have subsided in February, we maintain our prediction that the market will remain in a high-level consolidation phase before the Spring Festival. Furthermore, unlike the first wave of year-end rallies driven by sentiment and capital flows, the subsequent second wave of rallies needs to be based on logic, and if so, it is more likely to occur after the Spring Festival.
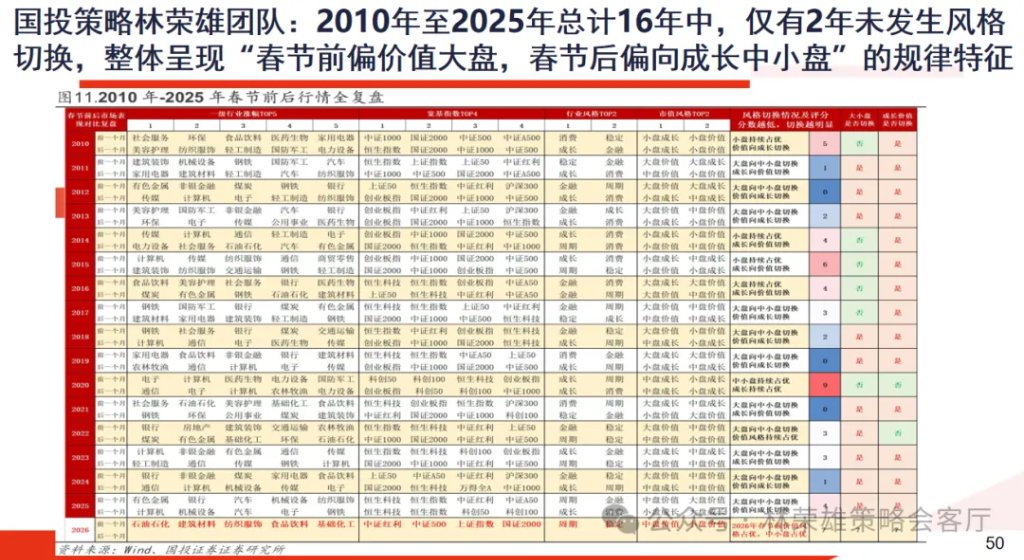
At the structural level, whether a style shift will occur in A-shares around the Spring Festival is a topic worthy of discussion in the short term. Based on a comparison of market performance one month before and after the Spring Festival from 2010 to 2025, it is clear that historically, the probability of a style shift around the Spring Festival is extremely high, generally showing a pattern of "pre-Spring Festival favoring value and large-cap stocks, and post-Spring Festival favoring growth and small-cap stocks."
The specific statistical conclusions are as follows: 1. In the 16 years from 2010 to 2025, there were only 2 years in which there was no switch between growth and value styles. A typical example of a switch was the collapse of the "Moutai Index" after the Spring Festival in 2021.
2. Historically, there is a high probability of a shift between large and small caps around the Spring Festival. In 8 out of 16 years, there was a significant shift between large and small caps (accounting for 62.5%). Without exception, these eight shifts were from large caps to small and mid-caps. This indicates that if the market is biased towards large caps before the Spring Festival, the probability of the market being biased towards small and mid-caps after the Spring Festival is very high.
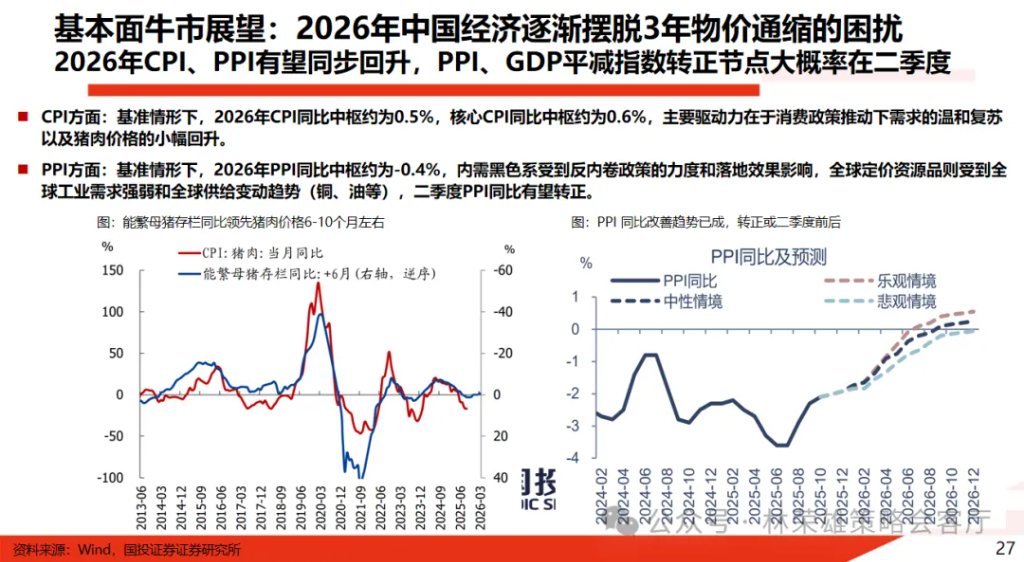
3. Historically, the top-performing sectors in the month leading up to the Spring Festival have a relatively high probability of not overlapping with those in the month following the festival. Current assessments suggest that the market style begins to shift towards value investing in the month leading up to the Spring Festival. For this value investing style to continue after the Spring Festival, the core logic revolves around the domestic trend of "saying goodbye to deflation." In fact, the pricing of "saying goodbye to deflation" has certain catalysts after the Spring Festival, such as policy expectations from the Two Sessions. The current point of contention lies in the elasticity and potential for continued upward movement in CPI and PPI.
Our consistent view is that the true end to deflation in 2026 is essentially a easing of international political turmoil and a shift in the economic cycle. So far, this logic has not been validated by data. Therefore, the notion that value stocks will further overwhelmingly outperform growth stocks after the Spring Festival lacks sufficient logical basis. We are more inclined to believe that technology growth stocks are likely to make a comeback after the Spring Festival.The "Four Pillars" (non-ferrous metals, chemicals, AI applications and power grid equipment, and construction machinery) remain the core of short-term positions, while the "Four Rebalancing" is the core of medium-term allocation. Remember: the "Four Pillars" for short-term and the "Four Rebalancing" for medium-term.
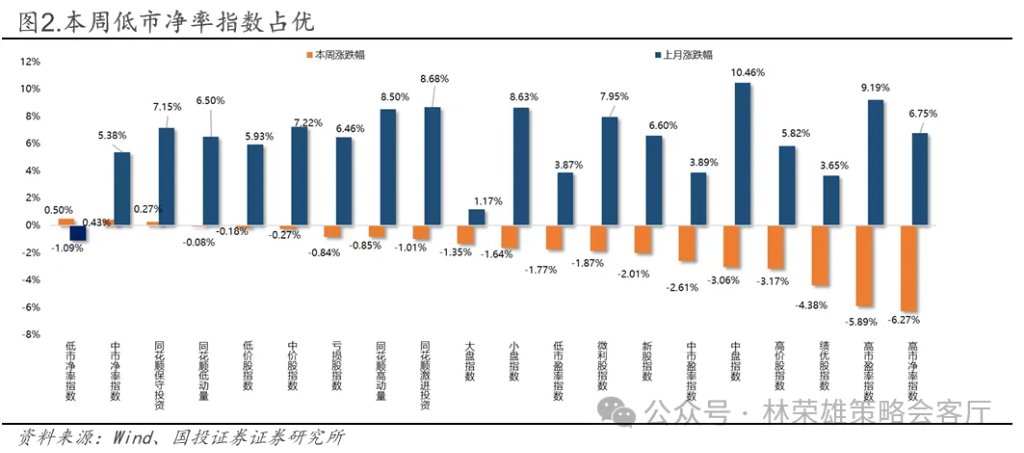
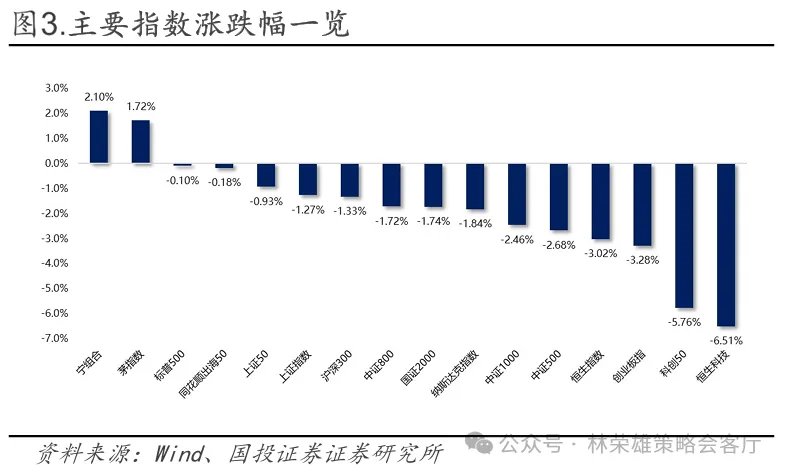
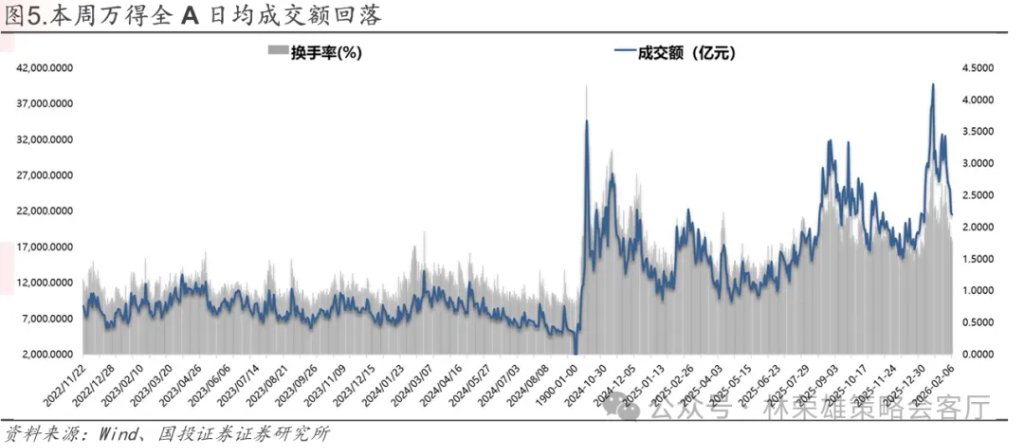
This week, the Shanghai Composite Index fell 1.27%, the CSI 300 fell 1.33%, the CSI 500 fell 2.68%, the ChiNext Index fell 3.28%, and the Hang Seng Index fell 3.02%. Value stocks outperformed growth stocks. The average daily turnover of all A-shares this week was 2.4032 trillion yuan, a slight decrease compared to last week.
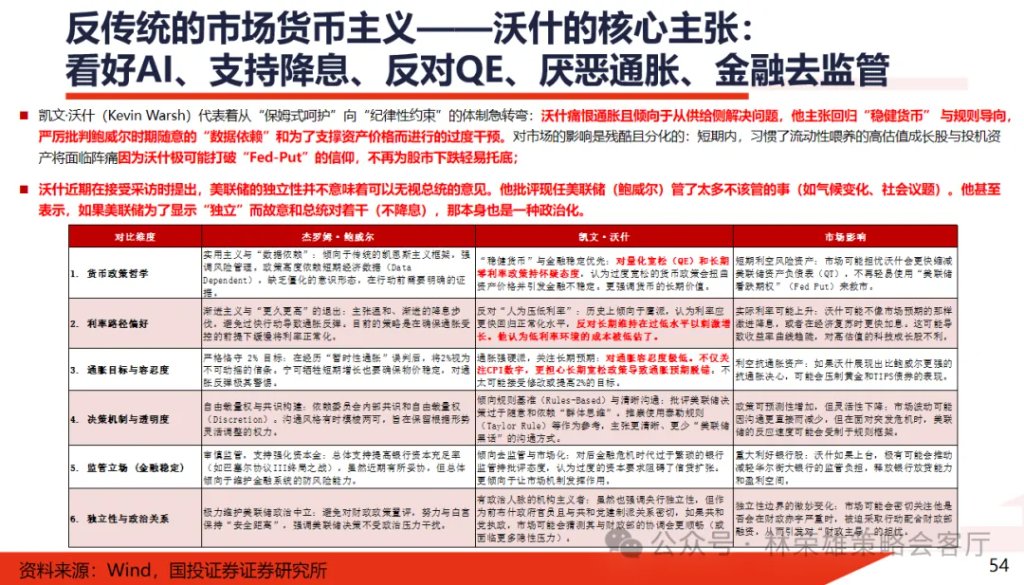
From a global perspective, the recent hawkish outlook of Federal Reserve Chairman Warsh and his "interest rate cuts + balance sheet reduction" approach are seen as intentionally draining liquidity from financial markets, leading to the recent sharp fluctuations in global assets. What is encouraging is that, compared to the declines in US stock and commodity prices, the A-share market has shown significantly greater resilience during this period, indirectly indicating that the current long-term bull market in A-shares is primarily priced in domestic factors and is less affected by external marginal impacts.
From an internal perspective, we have consistently emphasized our analytical framework over the past period: "A 5% increase during the year-end period can be driven by sentiment, 5-10% by incremental funds, and an increase of over 10% requires a clear logic." The short-term consolidation in mid-January demonstrates that our adherence to this framework and avoidance of overly aggressive moves was accurate.
With the significant outflows from broad-based ETFs coming to an end in February, we maintain our forecast: the market will remain in a high-level consolidation phase before the Spring Festival. Furthermore, unlike the first wave of year-end rallies driven by sentiment and capital flows, the subsequent second wave of market activity will need to be based on underlying logic, and if so, it is more likely to occur after the Spring Festival.

At the structural level, whether a style shift will occur in the A-share market around the Spring Festival is a topic worthy of serious discussion in the short term. Based on a comparison of market performance around the Spring Festival over a total of 16 years from 2010 to 2025, and by statistically analyzing the characteristics and patterns of industry, style, and broad-based index shifts before and after the Spring Festival, it is clearly found that historically, the probability of a style shift occurring around the Spring Festival is extremely high, generally exhibiting a pattern of "pre-Spring Festival favoring value and large-cap stocks, and post-Spring Festival favoring growth and small-cap stocks." Specific statistical conclusions are as follows:
1. In the 16 years from 2010 to 2025, there are only 2 years in which there is no shift between growth and value styles.A typical example of a shift is 2021, where core assets were heavily favored before the holiday, but the "Moutai Index" collapsed after the holiday, and small-cap value stocks rose. A typical example of no shift is 2017, where large-cap value/blue-chip stocks dominated both before and after the holiday, and the "Beautiful 50" market continued.
2. Historically, there is a relatively high probability of a shift between large and small-cap stocks around the Spring Festival. In 8 out of 16 years, there was a significant shift between large and small-cap stocks (accounting for 62.5%).Without exception, all eight of these market shifts involved a shift from large-cap to small-cap stocks, indicating that if the market favored large-cap stocks before the holiday, there is a high probability that the pricing will favor small-cap stocks after the holiday.
3. Historically, the top-performing sectors in the month before the Spring Festival have a relatively high probability of not overlapping with those in the month after the Spring Festival.
Current assessments indicate that during the market's upward movement from the mid-December low of 3815 points last year, various sectors have experienced a rotation. Looking at the market performance over the past three weeks, the market style began to shift towards value investing in the month leading up to the Spring Festival, while technology and growth stocks relatively declined.
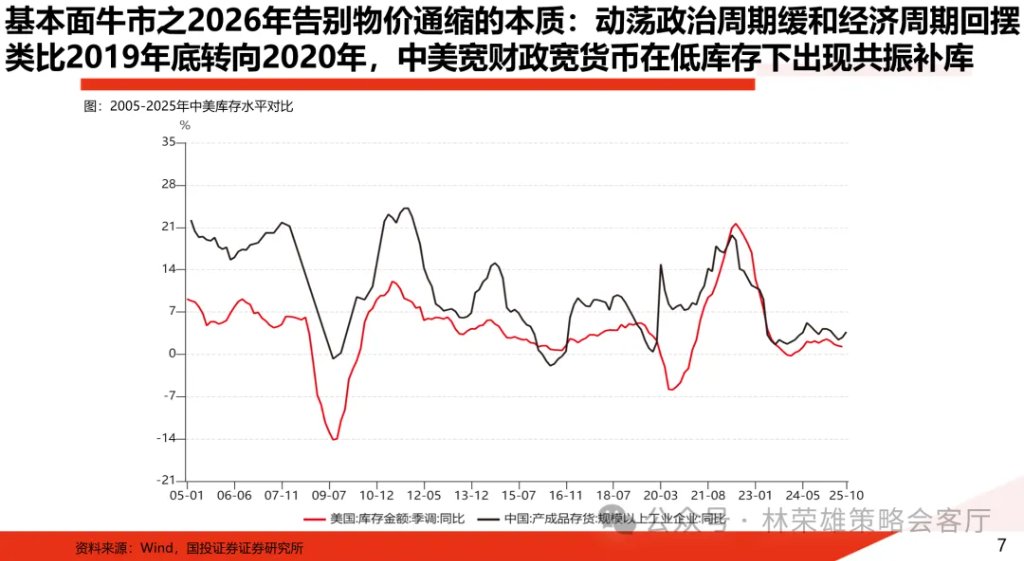
One scenario is that the value investing style before the Spring Festival will continue after the Spring Festival, with the core logic revolving around the domestic "farewell to deflation." In fact, pricing around "farewell to deflation" is somewhat catalyzed after the Spring Festival, for example, by policy expectations surrounding the Two Sessions. However, the point of contention regarding farewell to deflation in 2026 lies in the elasticity and room for continued upward movement in CPI and PPI. Our consistent view is that the true farewell to deflation in 2026 is essentially a easing of international political turmoil and economic cycle fluctuations, with a synchronized replenishment of inventories due to loose fiscal and monetary policies in China and the US at relatively low levels, analogous to the shift from the end of 2019 to 2020. So far, we haven't seen data to validate this logic.
Therefore, there is no sufficient logical basis for the value style to further overwhelmingly outperform growth after the Spring Festival. Currently, as the marginal impact of the Walsh theory weakens and overseas markets begin to stabilize, concerns about the impact of the sharp drop in precious metal prices on the performance of non-ferrous metals and overseas AI giants have been significantly alleviated. We are more inclined to believe that the technology growth style will make a comeback after the Spring Festival, and the "Big Four" will remain the core of the portfolio.
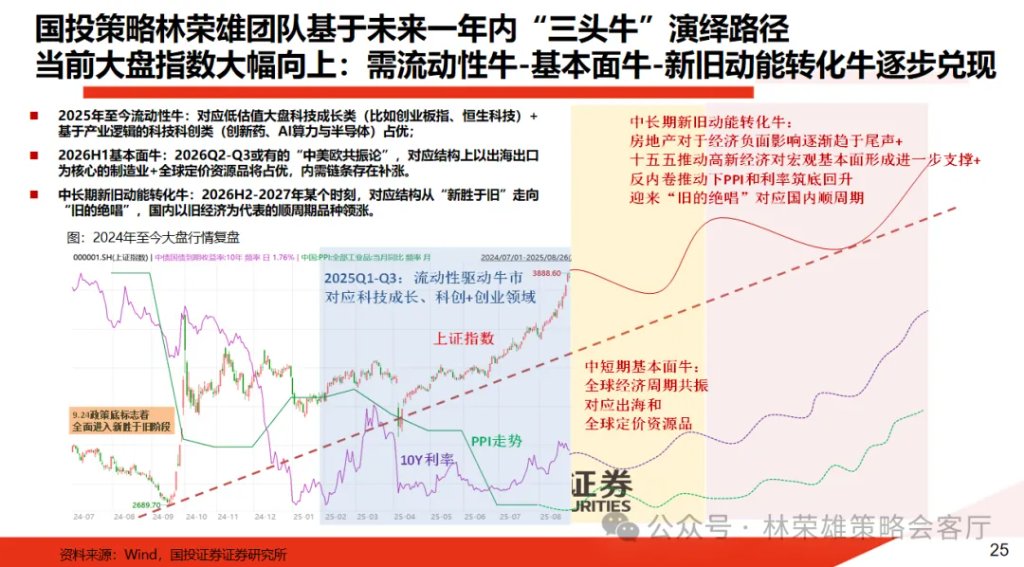
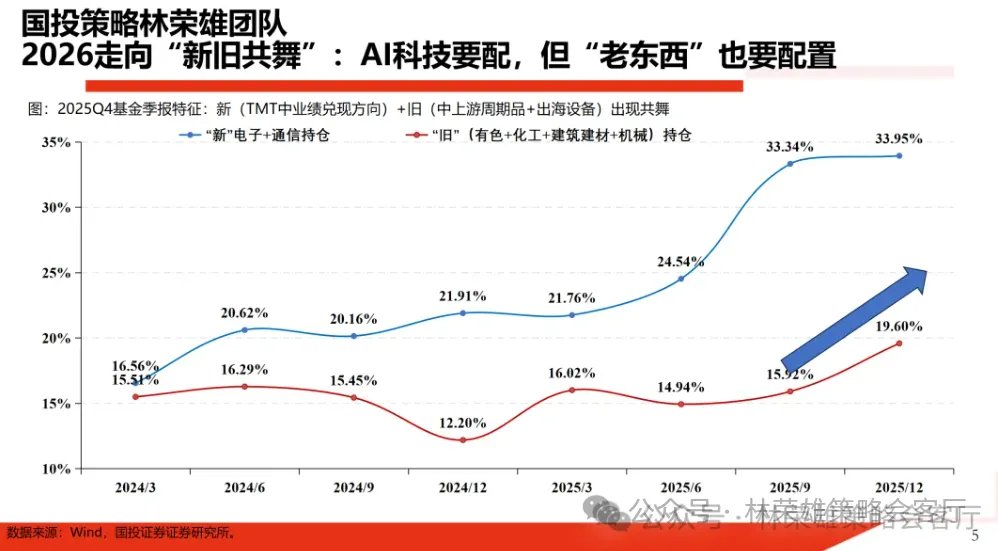
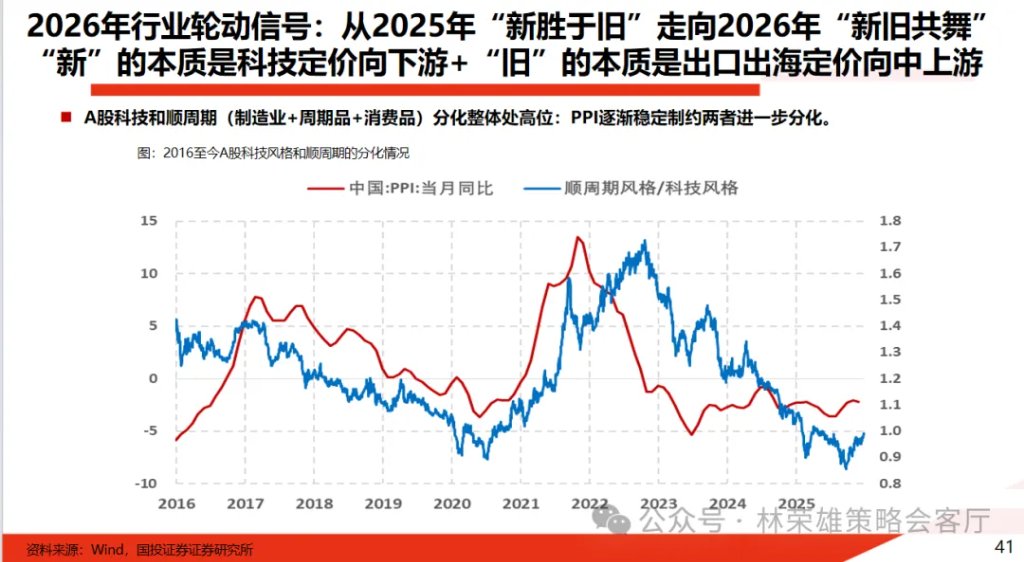
Here, looking towards 2026 in the medium term, we have repeatedly emphasized that a shift towards "four rebalancing" is underway, essentially moving from "new outperforming old" in 2025 to "new and old coexisting" in 2026. In short: in 2026, new AI technologies will be needed, but there will also be a significant increase in allocation to pro-cyclical sectors (manufacturing, cyclical goods), which is the most important rebalancing. Simultaneously, some important marginal changes will cause this rebalancing to manifest in the other three aspects:
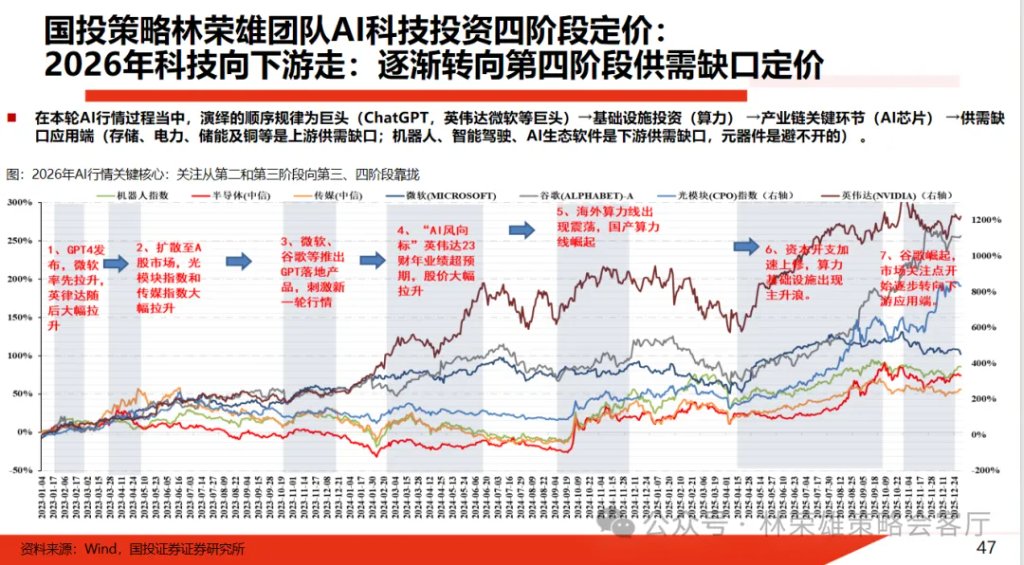
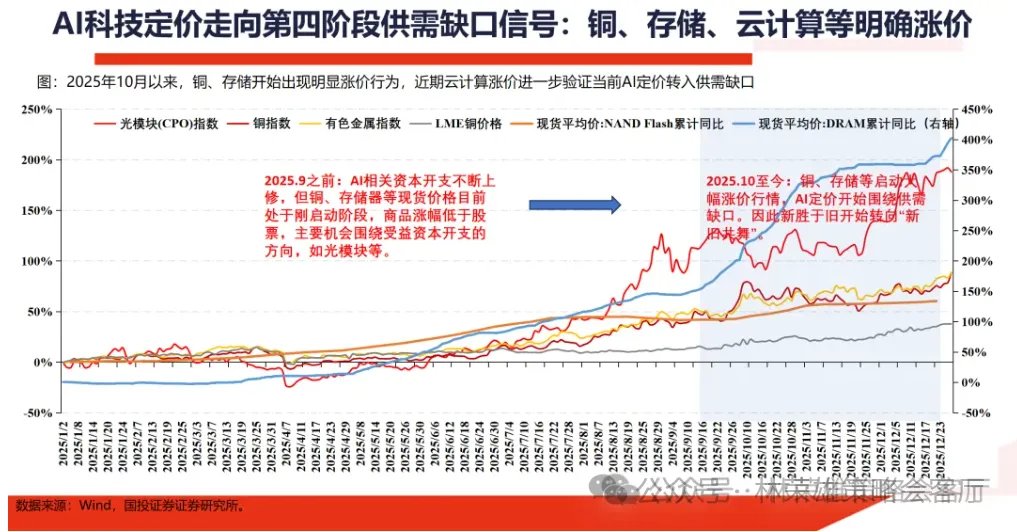
1. Rebalancing within the technology sector: The essence of "new" is "AI technology moving downstream," gradually transitioning to the fourth stage of supply and demand gaps (upstream gaps are copper, storage, and power equipment; downstream gaps are AI applications, components, etc.).
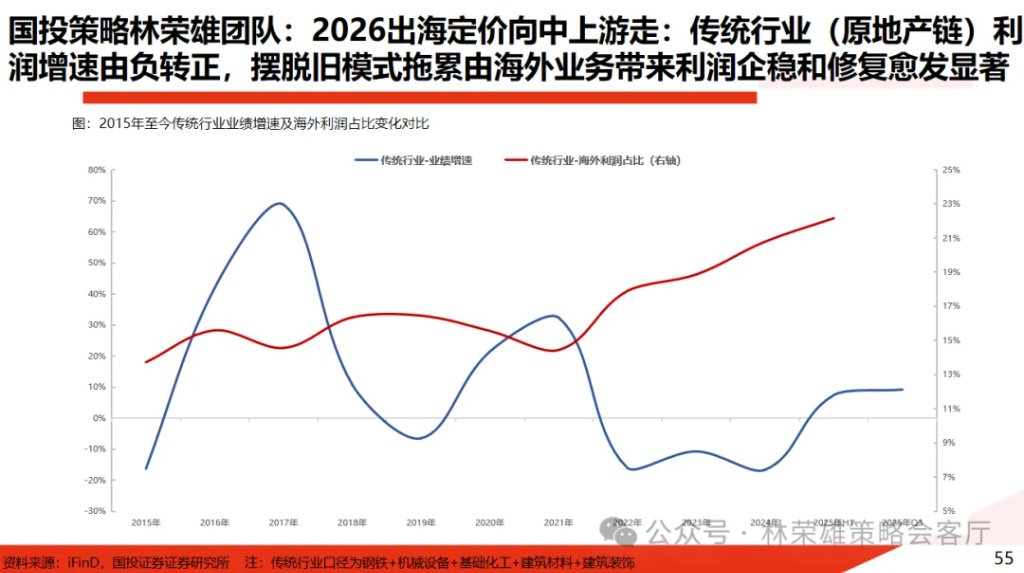
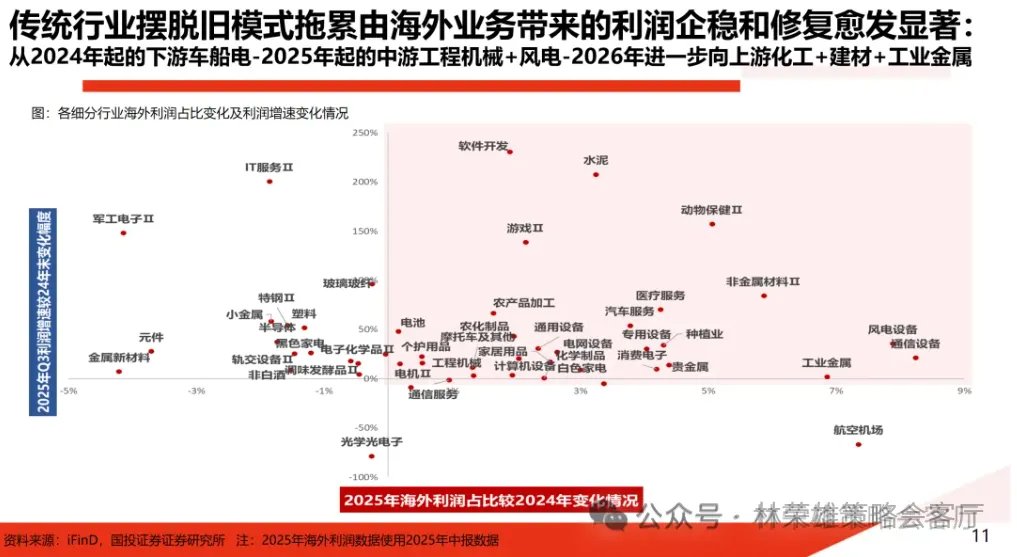
2. Rebalancing within the overseas market: The essence of the "old" is "exporting overseas and moving towards the mid-to-upstream." Traditional industries are shedding the drag of the old model, and the profits brought by overseas business are stabilizing and growing more significantly, extending from the mid-to-downstream manufacturing industry to the mid-to-upstream manufacturing industry (construction machinery, wind power, chemicals, building materials, industrial metals).
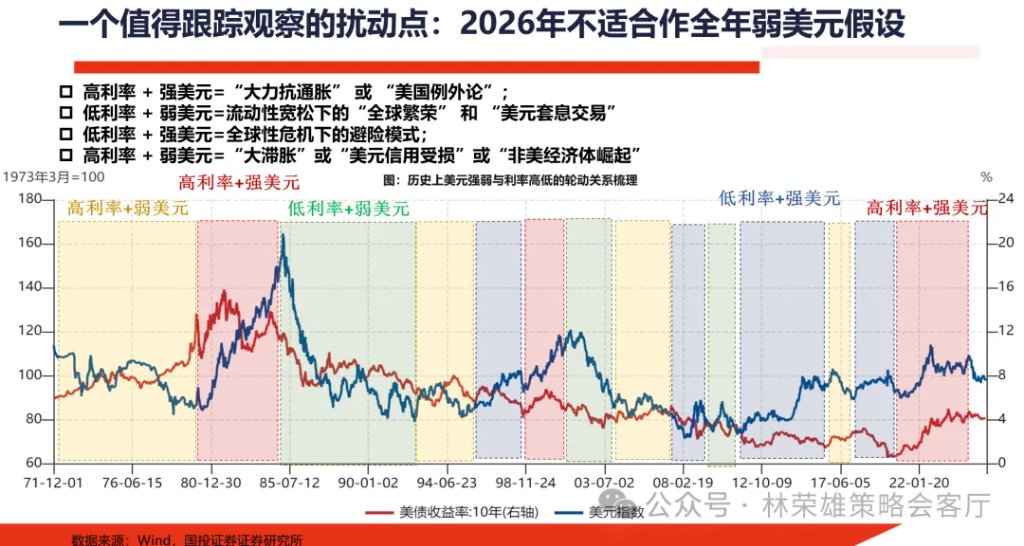
3. Rebalancing within resource commodities: The 2026 pricing of resource commodities should not assume a weak dollar throughout the year, as there is a possibility that the dollar will not be weak. We should focus on the return of commodity attributes to their original state and the decline of financial attributes. Resource commodities with price increases based on supply and demand fundamentals are more worthy of continued optimism.
Risk warning: Domestic policies may fall short of expectations, and overseas monetary policies may change more unexpectedly. Historical calculations do not represent future results.
Main text
1. Summary of key trading characteristics in the equity market recently
Based on recent discussions with market investors, and reviewing this week's global and A-share market conditions and environment, the following characteristics are worth noting:
Major U.S. stock indices showed mixed results this week. The Nasdaq fell 1.84%, the S&P 500 fell 0.10%, and the Dow Jones rose 2.50%. On the sector front, consumer staples led the gains with a 6.12% increase, followed by industrials with a significant 4.58% rise, and materials also performed strongly, rising 3.68%. Additionally, energy, financials, real estate, healthcare, and utilities all saw gains, rising 3.05%, 2.13%, 1.93%, 1.70%, and 0.58%, respectively. On the other hand, several sectors experienced pullbacks this week, with the communications sector leading the decline with a 3.96% drop, followed by consumer discretionary and information technology sectors, which fell 2.02% and 0.44%, respectively.
This week's US stock market performance was mainly driven by pressure on tech stocks due to massive AI investments and a rotation of funds into traditional sectors. Firstly, the capital expenditure plans announced by tech giants, led by Amazon, far exceeded market expectations (e.g., Amazon plans to spend up to $200 billion), triggering serious concerns about their short-term profitability, causing a sharp drop in stock prices and dragging down the Nasdaq.Second, weak earnings forecasts from companies like Qualcomm, lackluster midweek employment data, and uncertainty surrounding Federal Reserve personnel exacerbated the sell-off in tech stocks. Third, market sentiment reversed on Friday, with strong consumer confidence data boosting economic confidence. Funds flowed significantly out of tech stocks and into Dow Jones Industrial Average components, which are more sensitive to economic cycles, pushing the Dow to a record high, aided by rallies in stocks like Nvidia.
This week, the US stock market experienced typical sector rotation and sentiment shifts. The declines in the Nasdaq and S&P 500 primarily reflected short-term risk aversion in the market due to the contradiction between the high valuations of tech stocks and massive capital expenditures; while the Dow Jones's counter-trend rise reflected a rebalancing of funds from growth stocks to value stocks as economic growth expectations improved. This divergence indicates that the current market focus is shifting from a grand narrative about AI to a pragmatic assessment of short-term profitability and economic resilience.
Hong Kong stocks generally declined this week. The Hang Seng Index fell 3.02% cumulatively, and the Hang Seng Tech Index fell 6.51%. The Hong Kong stock market continued to show a structural divergence in sector performance this week, but the specific distribution of sector gains and losses differed significantly from previous descriptions. Specifically, the consumer staples sector led the gains with a significant increase of 3.43%; the industrials, conglomerates, and real estate and construction sectors also bucked the trend, rising by 1.00%, 0.61%, and 0.17% respectively. On the other hand, the number of declining sectors was large, and the declines were significant: the information technology and materials sectors saw the most significant drops, plummeting by 7.86% and 6.35% respectively; the consumer discretionary, telecommunications, financial, healthcare, energy, and utilities sectors all experienced varying degrees of decline, ranging from 0.20% to 1.64%.
Hong Kong stocks fell this week. From a news perspective: First, the nomination of Kevin Warsh, a hawkish figure in the United States, as the next chairman of the Federal Reserve disrupted expectations of interest rate cuts, exacerbated the pressure on foreign capital to withdraw from emerging markets, and caused a historic plunge in commodity markets. Prices of gold, silver and other commodities plummeted, directly dragging down related sectors and triggering risk aversion in global risk assets.Second, market rumors that China might raise the value-added tax rate on internet services, despite analysts indicating low credibility, have severely impacted investor confidence in leading tech stocks such as Tencent and Alibaba. Third, concerns within the tech industry have intensified, with the market worried that giants might engage in a price war to promote AI services, eroding profits. Furthermore, the latest economic data from China showing a decline, coupled with increased profit-taking ahead of the Spring Festival holiday, have collectively dampened market sentiment.
This week's sharp decline in Hong Kong stocks, particularly the Hang Seng Tech Index, was a result of a confluence of external shocks, negative industry rumors, and internal concerns about growth. Unlike the Dow Jones Industrial Average, which is more sensitive to economic cycles, Hong Kong stocks, as an offshore market, are heavily weighted towards technology and finance. This structure made them vulnerable to both the anticipated tightening of global liquidity and specific negative news targeting the technology sector, resulting in a much larger drop than US stocks during the same period. The market trend reflects a shift in investor pessimism from concerns about short-term profits to a reassessment of the long-term policy environment for the industry. However, after the rapid decline, the Hang Seng Tech Index's valuation has entered a historically low range, and the market's excessive panic may present an opportunity for long-term investment.
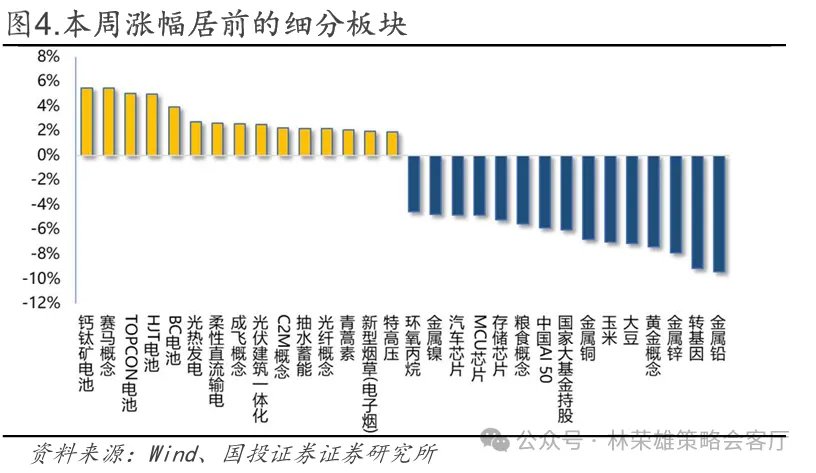
This week, the Shanghai Composite Index fell 1.27%, the CSI 300 fell 1.33%, the CSI 500 fell 2.68%, the ChiNext Index fell 3.28%, and the Hang Seng Index fell 3.02%. Value stocks outperformed growth stocks, with large-cap stocks leading the gains. In terms of sectors, perovskite batteries and horse racing concepts led the gains. The average daily turnover of all A-shares this week was 2.4032 trillion yuan, a slight decrease compared to last week.
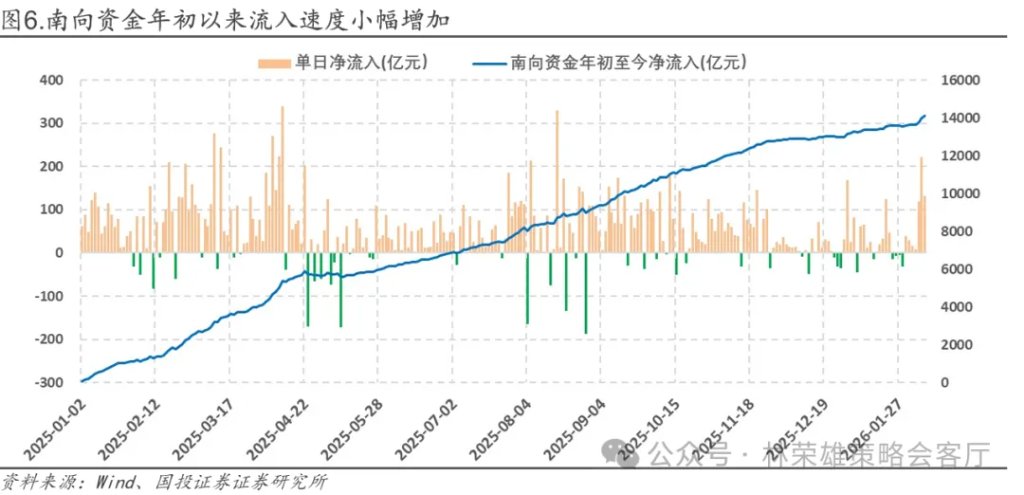
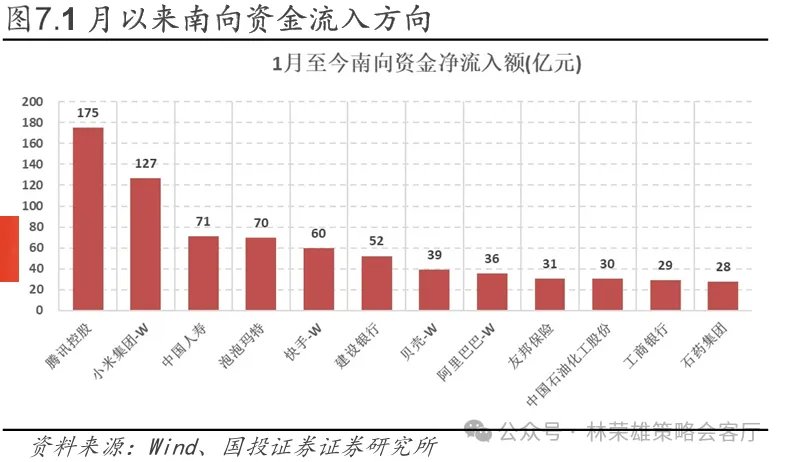
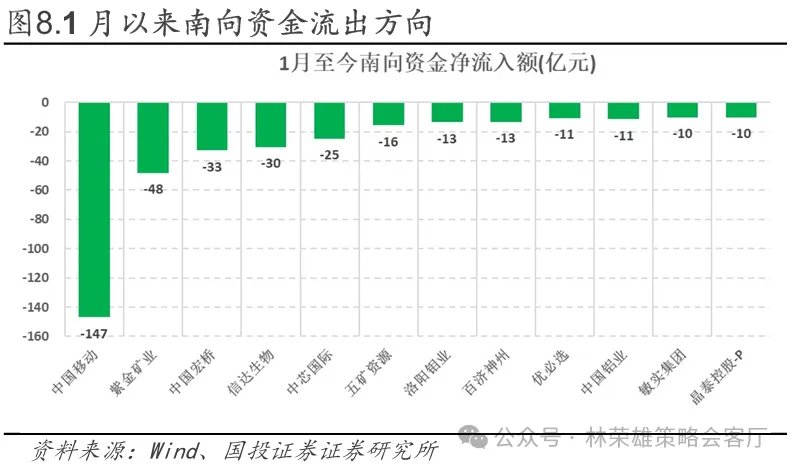
Second, in terms of incremental funds, southbound capital has resumed inflows since 2026.As of February 6, since 2025, southbound capital inflows into Hong Kong stocks have reached RMB 1.4118 trillion, with a net inflow of RMB 111.5 billion this year, including nearly RMB 50 billion this week alone. Structurally, since January, southbound capital has favored internet stocks (Tencent, Xiaomi, Kuaishou-W, Alibaba) and financial stocks (China Construction Bank, Industrial and Commercial Bank of China, China Life Insurance, AIA). On the other hand, net outflows have mainly been concentrated in telecommunications (China Mobile), biopharmaceuticals (Innovent Biologics, BeiGene), and precious metals (Zijin Mining, China Hongqiao, Minmetals Resources, Luoyang Molybdenum, Aluminum Corporation of China). This rebalancing of southbound capital inflows also reflects some recent obstacles encountered by the Hong Kong stock market.
From the denominator perspective, due to concerns about the pressure of share lock-up expirations (the large-scale unlocking of shares in CATL, Hengrui Medicine, and other related companies directly impacted market sentiment), mutual fund portfolio adjustments deviating from the benchmark, the Bank of Japan's interest rate hike, and the Federal Reserve's hawkish stance, the inflow of southbound funds has slowed significantly since November last year. At the same time, the strong performance of other Asian markets such as Japan and South Korea has also suppressed liquidity in the Hong Kong stock market.
From the perspective of the numerator, traditional industries are hampered by the weakening PPI and the downturn in the real estate market, while the technology sector is unable to further revise its profit expectations due to factors such as the prospects for capital expenditure (chip restrictions) and industry competition. As a result, from a fundamental point of view, the current Hong Kong stock market does not have the relatively high prosperity to attract foreign investment.
Regarding ETF funds: This week, ETF funds generally showed a net outflow trend, with the CSI 500 ETF being the most prominent, experiencing a net outflow of 14.2 billion yuan. The CSI 300, CSI 1000, and SSE 50 saw net outflows of 7.8 billion, 5.8 billion, and 1.7 billion yuan respectively, while the CSI A500, CSI A50, and ChiNext saw slight outflows. In terms of thematic ETFs, there was a slight net inflow overall, with the chip ETF, securities ETF, dividend ETF, and pharmaceutical ETF experiencing net outflows of 2.83 billion, 2.35 billion, 1.182 billion, and 791 million yuan respectively. Hong Kong-listed internet stocks and the Nasdaq saw net inflows of 14.604 billion yuan and 45 million yuan respectively.
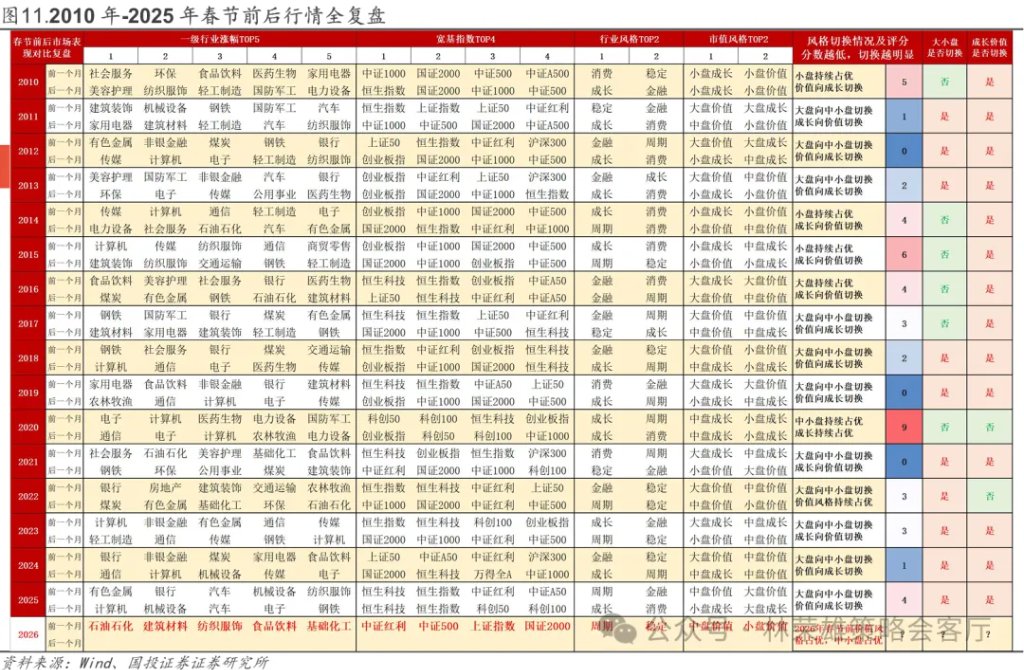
Third, next week is the last trading week before the Spring Festival, and the market is highly focused on the possibility of a market style shift after the holiday and pre-holiday portfolio allocation strategies. Here, based on a comparison of market performance one month before and after the Spring Festival over a total of 16 years from 2010 to 2025, we have compiled statistics on the characteristics and patterns of sector, style, and broad-based index shifts before and after the Spring Festival. Specific conclusions are as follows:
First, historically, the probability of a shift between growth and value styles occurring around the Spring Festival is extremely high. Of the 16 years from 2010 to 2025, only 2020 and 2022 are exceptions. In 2020, the growth style continued from before to after the Spring Festival, while in 2022, the value style persisted throughout the period. In the remaining years, a clear shift from value to growth (accounting for 8 years, 50%) or from growth to value (accounting for 6 years, 37.5%) occurred. Therefore, the market style tends to shift towards value in the month before the Spring Festival, which may mean that a rebalancing towards growth style is highly likely after the Spring Festival.
Secondly, historically, the probability of a large-cap/small-cap switch occurring around the Spring Festival is moderately high. In 5 out of 16 years (31.25%), no such switch occurred, while in 11 years (68.75%), a switch did occur. Without exception, all eleven such switches involved a shift from large-cap to mid-cap and small-cap stocks. In other words, the probability of small-cap and mid-cap stocks outperforming after the Spring Festival is quite high, and the current trend of small-cap and mid-cap stocks outperforming is expected to continue after the Spring Festival.
Third, historically, there's a high probability that the top-performing primary industries around the Spring Festival are completely different. In 10 out of 16 years (62.5%), the top five performing primary industries before and after the Spring Festival were entirely different. In the remaining 6 years, only one of the top five performing industries overlapped. Looking back one month before this year's Spring Festival, without considering next week's market performance, the top five performing industries were oil and petrochemicals, building materials, textiles and apparel, food and beverage, and chemicals. A significant portion of these industries may weaken after the Spring Festival.
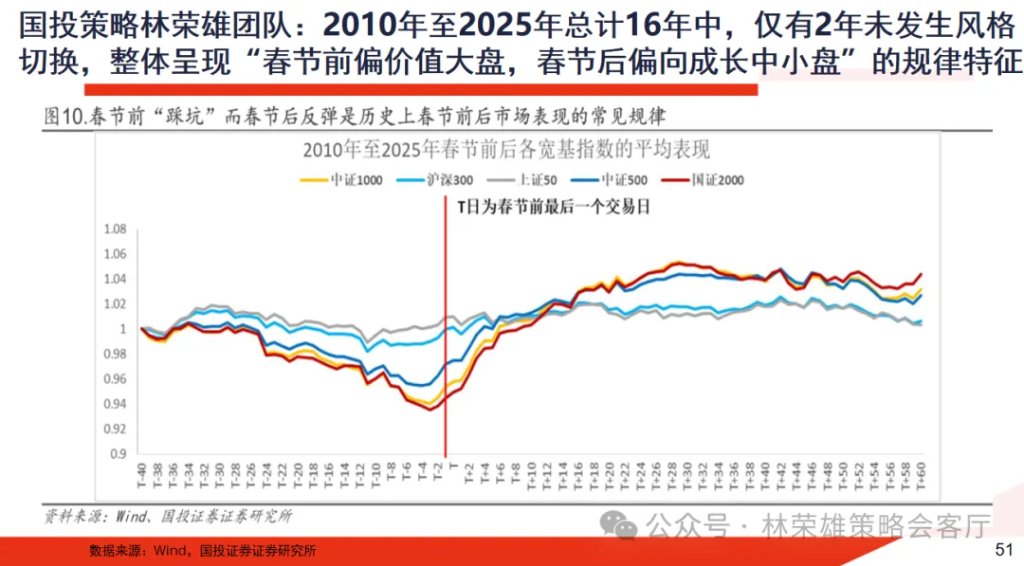
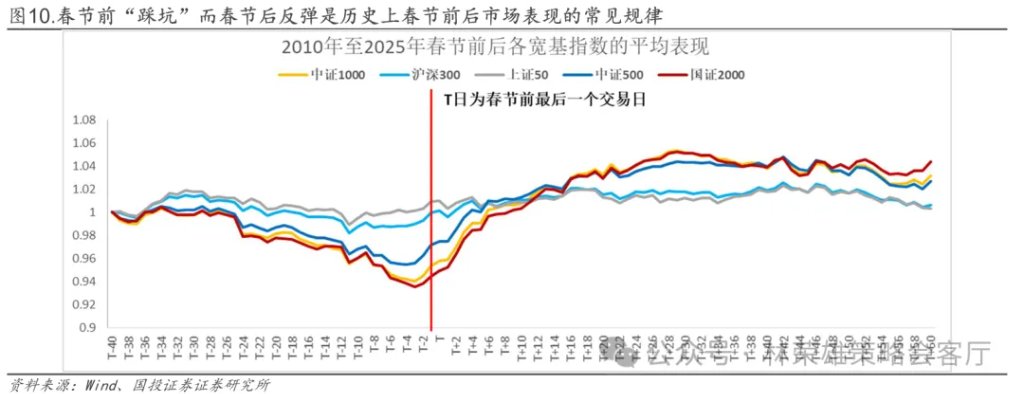
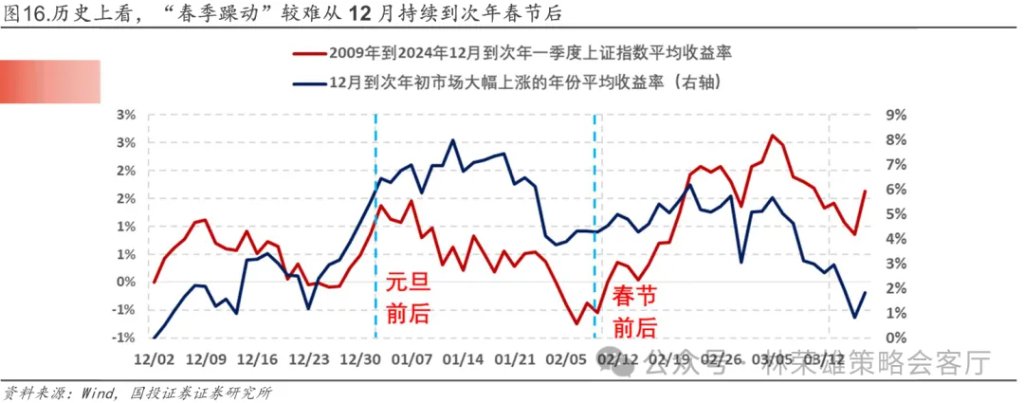
Fourth, regarding the major market indices, as we emphasized in our review of the spring rally, the spring rally is unlikely to continue from December to April of the following year. It is more common for there to be a "pitfall" in the middle. From the perspective of the period before and after the Spring Festival, on average, the major broad-based indices will fluctuate and adjust before the Spring Festival, while small-cap stocks will show more elasticity after the Spring Festival.
Fifth, we scored the style shifts around the Spring Festival each year based on the overlap between the top-performing industries, broad-based indices, and styles. Higher scores indicate greater overlap, while lower scores indicate more pronounced shifts. Typical years since 2010 that saw significant style shifts around the Spring Festival include:
In 2012, after a sharp decline throughout 2011, market valuations were at a low level.In early January 2012, fueled by multiple positive factors including record highs in US stocks, a shift towards looser domestic monetary policy, and Premier Wen Jiabao's call to "boost stock market confidence," the A-share market embarked on a nearly two-month-long spring rally. Initially, resource stocks, benefiting from recovery expectations, rebounded collectively after PMI data improved. Following the Spring Festival, the European debt crisis, coupled with the central bank's reserve requirement ratio cut, and the lack of significant improvement in economic data, disproved the strong recovery narrative. The market then shifted its focus to small-cap and technology growth stocks, whose pricing is more sensitive to liquidity.
In 2019, before the Spring Festival, the market sentiment recovered from the bottom due to the easing of Sino-US trade frictions, but the market style was mainly cyclical and consumer sectors. It was not until after the Spring Festival that the comprehensive reduction of the reserve requirement ratio was implemented, and the market sentiment improved rapidly with the support of liquidity. Technology growth style represented by 5G communication and consumer electronics began to lead the rise.
In 2021, before the Spring Festival, the market was at the peak of the "core asset" rally, with the "Moutai Index," represented by Kweichow Moutai, continuously hitting new highs, showcasing the ultimate growth style of the market. However, during the Spring Festival, rising inflation and expectations of interest rate hikes in the United States triggered expectations of liquidity tightening. Coupled with the massive issuance of mutual funds, market concerns began to emerge. After the Spring Festival, core assets collectively declined, while defensive sectors outperformed, and the style shifted sharply from growth to value.
In 2024, on the eve of the Spring Festival, the CSI 2000 and Wind Micro-Cap Index, representing small and micro-cap stocks, experienced a liquidity-depleted decline due to concentrated inflows of "Snowball" derivatives and deleveraging by quantitative funds, leading to a shift in market sentiment towards risk aversion and defense. After the holiday, market sentiment began to improve following the entry of market-rescue funds, and the market returned to a small and mid-cap growth style.
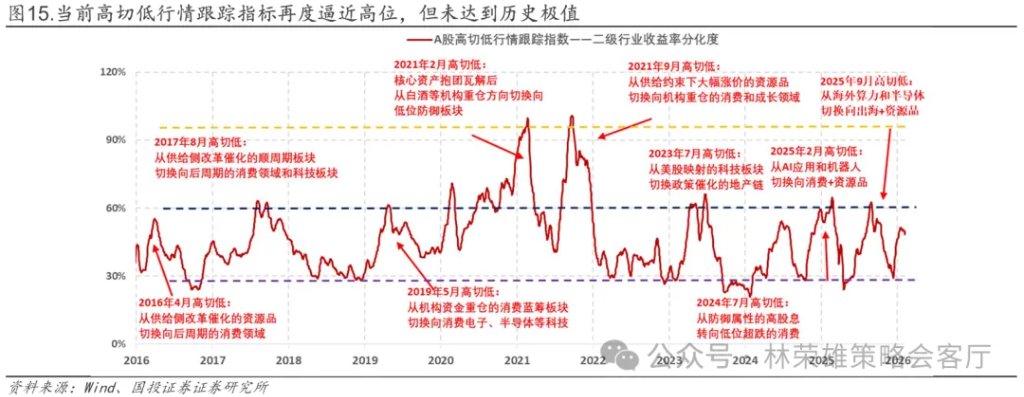
Fourth, as of this Friday, despite significant fluctuations in precious metal prices and a decline in risk appetite in global capital markets, the A-share market has maintained its resilience, stabilizing and consolidating immediately after a slight pullback. We believe that, as I stated regarding this round of "volatile market," the profit-making effect continues to show signs of spreading. From the market's high-low transition in November to its completion of adjustments and subsequent divergence in December, our team's trading tracking indicators have consistently provided crucial guidance at several key junctures. Looking ahead to the market from January to the Spring Festival, based on the high-low transition index, the main theme clarity index, and the A-share "volatile" index, we observe three main characteristics for the market at the beginning of 2026: the start of a "volatile" market driven by accumulated profit-making effects; a shift in market focus from high-speed rotation to a new main theme; and the start of a new round of high-low divergence. Specifically:
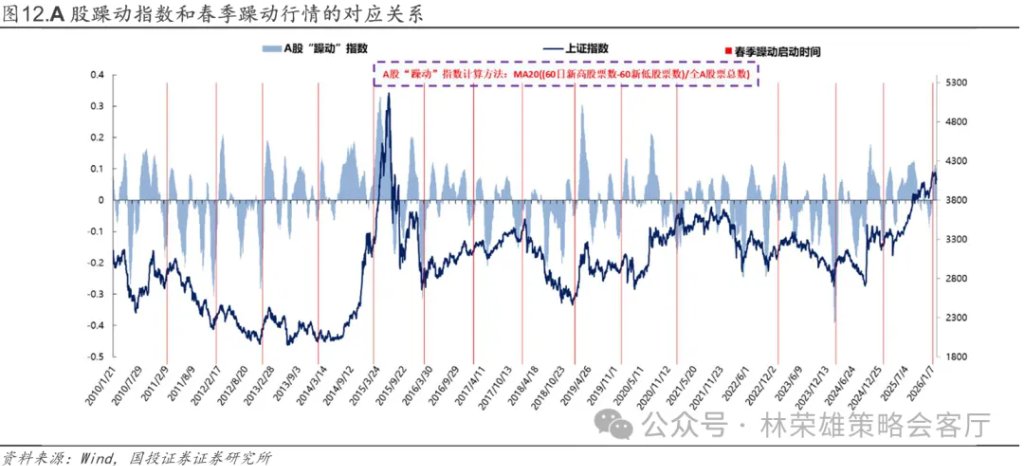
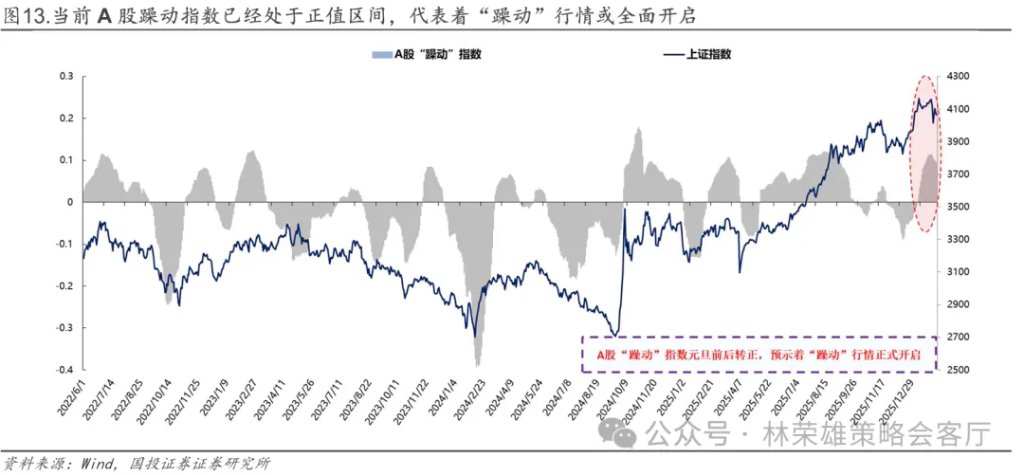
Firstly, regarding the current market's highly anticipated "spring rally," we constructed an A-share "Rally" Index. This index measures the market's profit-making effect by calculating the percentage difference between the number of stocks hitting 60-day highs and those hitting 60-day lows, thus reflecting investor sentiment and trading structure. Historically, when the "Rally" Index crosses above the zero line, turning positive, it signifies a significant improvement in market sentiment and the start of a "rally" phase. Generally, a positive turn in the A-share "Rally" Index, i.e., breaking above the zero line, should be considered a confirmation signal of a trend formation. Around New Year's Day, the index gradually recovered from its low of -9.67% on December 17th to around 0%, indicating that the accumulated profit-making effect was sufficient to initiate a "spring rally." This week, the "Rally" Index remained in the 8%~9% range, suggesting that the "rally" trend is still ongoing.
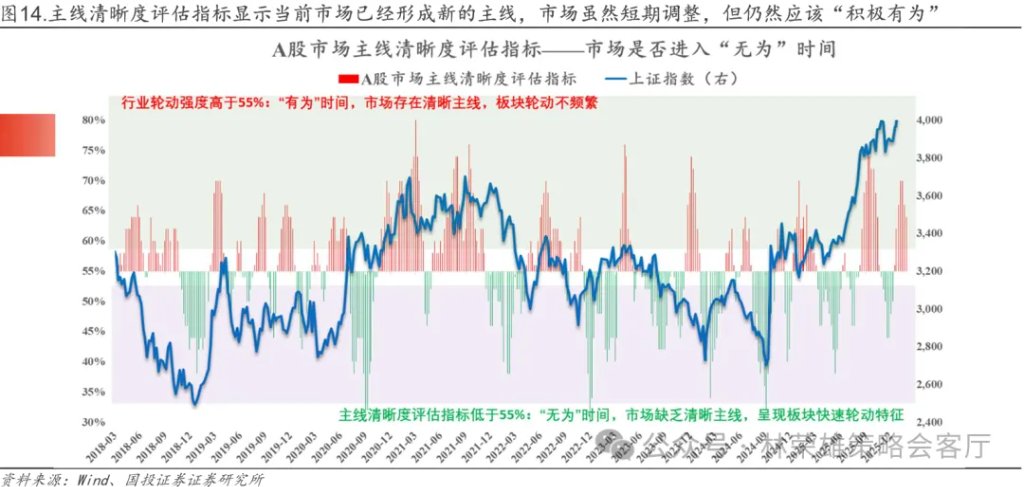
Secondly, to characterize whether the current market's main theme is clear, we statistically analyzed the weekly rankings of first-tier industries based on their weekly gains and losses. We also counted how many industries were unique among the top five performing industries over a rolling four-week (one-month) period. Clearly, the highest value was 20, meaning the top five performing first-tier industries changed every week for the past four weeks, indicating a highly chaotic market theme. The lowest value was 5, meaning the top five performing first-tier industries remained unchanged for the past four weeks, indicating a clear main theme and highly stable leading industries. After five periods of smoothing and normalization, we obtained an A-share market main theme clarity assessment index. Historically, this value has fluctuated between 30% and 80%. We can then further...The two intervals (55%~80% and 30%~55%) are defined as the "active" time when the main line is clear and the "inactive" time when the main line is chaotic.
Overall, the market entered a period of relative instability with a lack of clear direction starting in November. We believe that this relative instability is normal after the end of a high-to-low market trend, and there's no need to be overly concerned about the overall market trend. Historically, each period of instability in the main market direction lasts 3-4 weeks.
It's worth noting that the A-share market's main theme clarity assessment index, after rebounding to 70% in early January, remained at a high level of 64% this week. This indicates that the market has gradually identified a pro-cyclical chain centered on non-ferrous metals and chemicals, and a technology chain centered on military (commercial aerospace) and AI hardware (storage). Even with some pullbacks in precious metals and AI sectors, the market quickly shifted towards cyclical commodities like oil and gas, coal, and growth sectors like new energy and communications as alternatives. We believe the A-share main theme sentiment index signals that although the market may experience fluctuations before the Spring Festival, it remains a period of "active participation."
Finally, the market is currently experiencing another round of high-low divergence. According to our A-share high-low divergence tracking indicator, we have repeatedly emphasized that the high-low divergence index reached a historical low starting in December, meaning the pullback in high-flying sectors is nearing its end and a new leading sector is about to emerge. This week, the high-low divergence index rebounded from 37% at the end of December to around 52% on January 28th, before slightly declining to 45% this week (February 6th) as the market cooled down. The high-low divergence index has left the bottom range and re-entered a new upward cycle, signifying the start of a new round of high-low divergence. While the current upward momentum of the high-low divergence index has slowed, its absolute level being close to the high of the range does not necessarily indicate a reversal signal. Therefore, we believe that the signal given by the high-low divergence index suggests that a large-scale high-low shift (such as a shift towards the domestic consumption chain) would be quite risky.
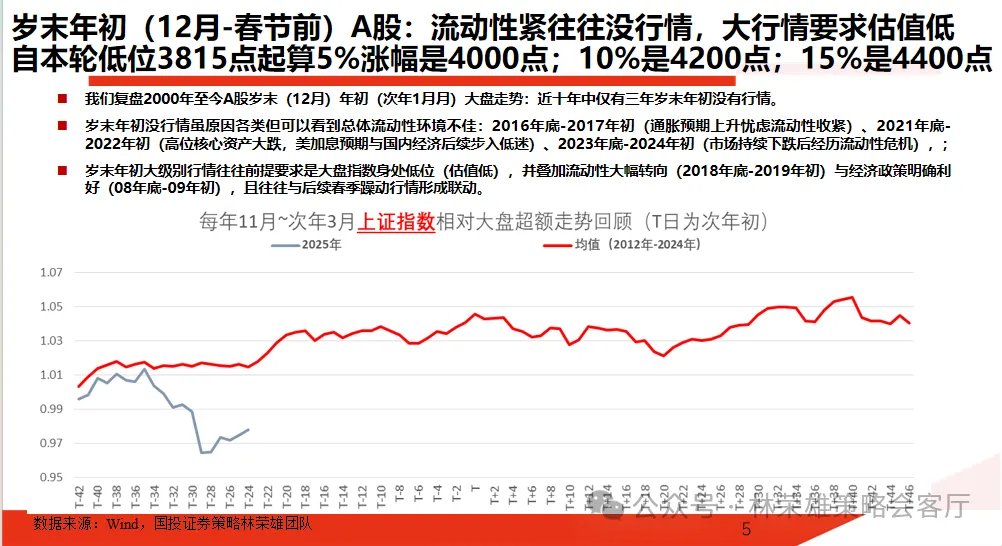
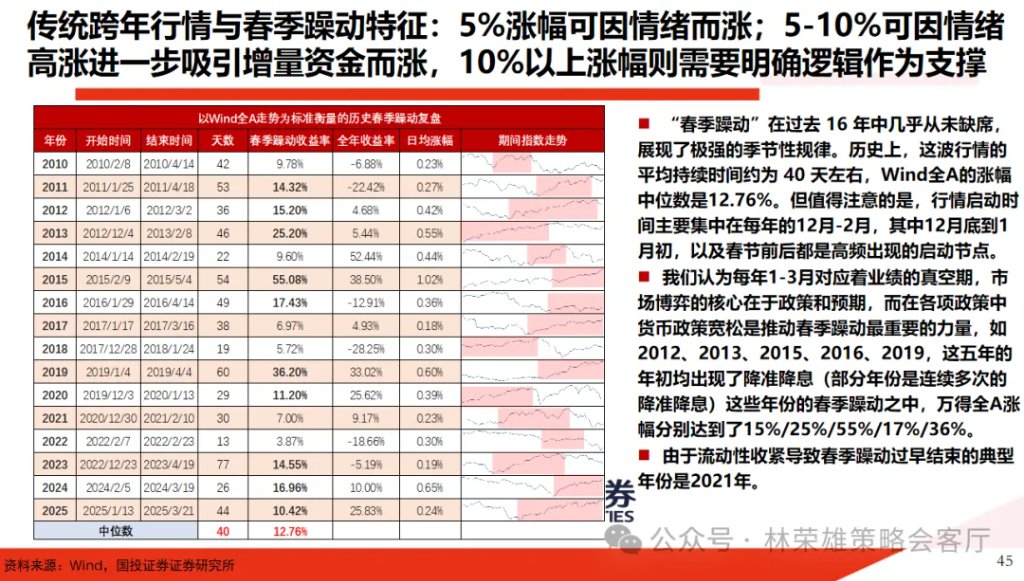
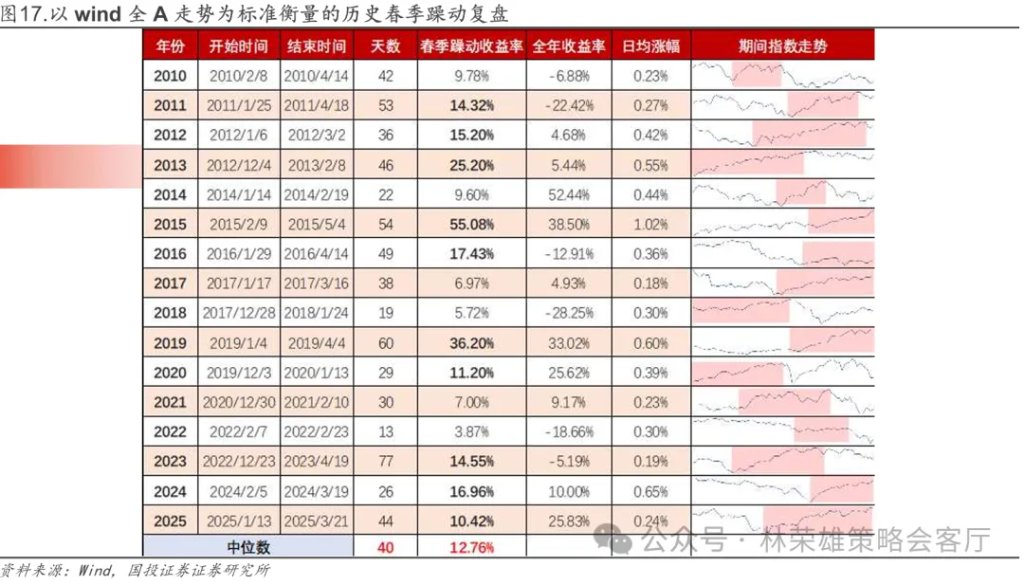
Fifth, based on our analysis of historical market trends, the spring rally has three characteristics: 1. It typically begins between December and February; 2. Policy changes and shifts in economic expectations are the most common catalysts; 3. The average return during this period is 10-15%. The "spring rally" has almost never been absent in the past 16 years, demonstrating a very strong seasonal pattern. Historically, this rally has lasted an average of about 40 days, with a median gain of 12.76% for the Wind All A index.
However, it's worth noting that the market rally typically begins between December and February each year, with late December to early January and around the Spring Festival being frequent starting points. Furthermore, a noteworthy pattern in the current market is that the "spring rally" rarely lasts from December of the previous year until after the Spring Festival of the following year. Historically, the Shanghai Composite Index's spring rally has typically exhibited a pattern of "pre-New Year warm-up" – "pre-Spring Festival pullback" – "full-scale rally after the Spring Festival." This is especially true if the rally begins in December, which is prone to a "plunge" before the Spring Festival. My analysis of years with significant market gains in December (such as 2010, 2013, 2019, 2020, and 2021) shows that the Shanghai Composite Index averaged a 7% increase from late December to early January in these years (the Shanghai Composite Index's increase from mid-December 2025 to the present is exactly around 7%). Subsequently, the market's trading sentiment gradually cools before the Spring Festival due to the holiday effect, often leading to a correction, before a second wave of the rally begins after the Spring Festival.
We believe that January to March each year corresponds to a performance vacuum period, and the core of market competition lies in policy and expectations. Among various policies, monetary easing is the most important force driving the spring rally. For example, in 2012, 2013, 2015, 2016, and 2019, there were reserve requirement ratio and interest rate cuts at the beginning of the year (in some years, multiple consecutive cuts). During the spring rallies in these years, the Wind All A-shares rose by 15%, 25%, 55%, 17%, and 36%, respectively. The typical year in which the spring rally ended prematurely due to tightening liquidity was 2021. Typical years that benefited from policy changes include: the 2012 Two Sessions' economic growth target "below 8%", the Central Economic Work Conference at the end of 2012 "placing stable growth in a more important position", the supply-side reform at the beginning of 2016, the slight rebound in social financing under "stabilizing leverage" at the beginning of 2019, and the shift in the pandemic situation and the "16 Financial Measures" at the end of 2022. The key points of the spring rally are often related to important policy changes.
Looking at the correlation between price fluctuations and driving factors, in years lacking new capital inflows but only experiencing sentiment recovery, the market index typically rises by around 5%, as seen in 2017, 2018, and 2021. Conversely, in years with new capital inflows such as ETFs, northbound funds, or margin trading, the market index often rises by around 10%, as seen in 2011, 2020, and 2023. If sentiment recovery combined with new capital inflows is accompanied by improvements in macroeconomic policies or fundamentals, the rise will significantly exceed 10%, as seen in 2015 and 2019.
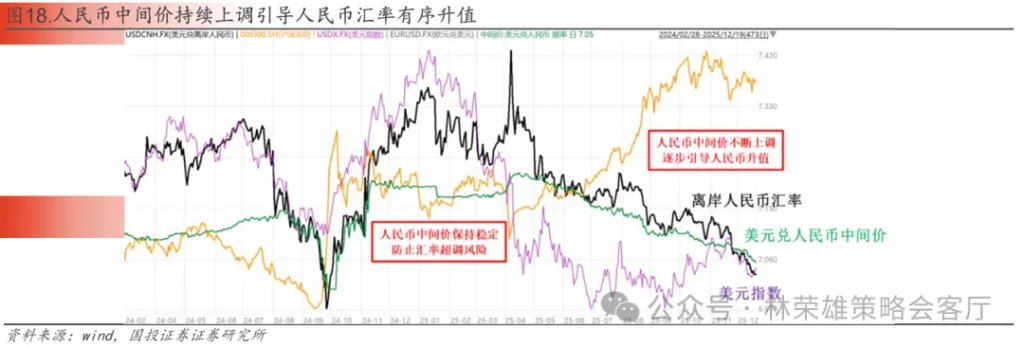
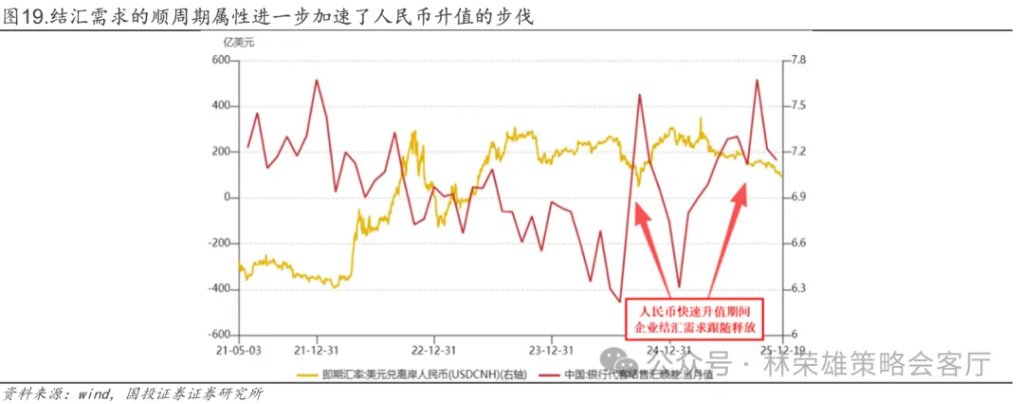
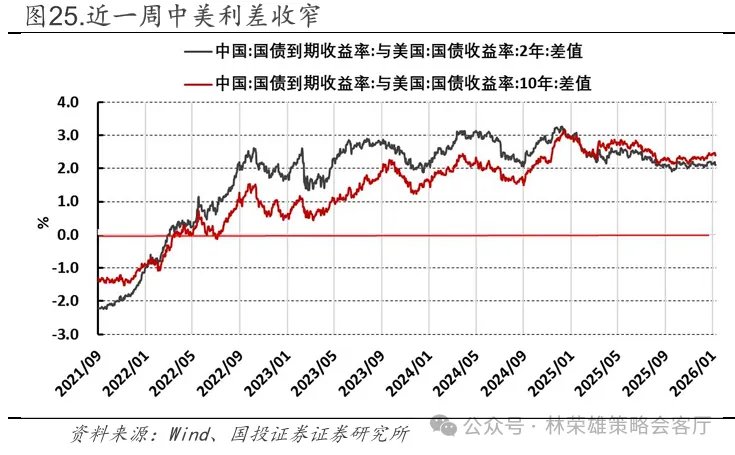
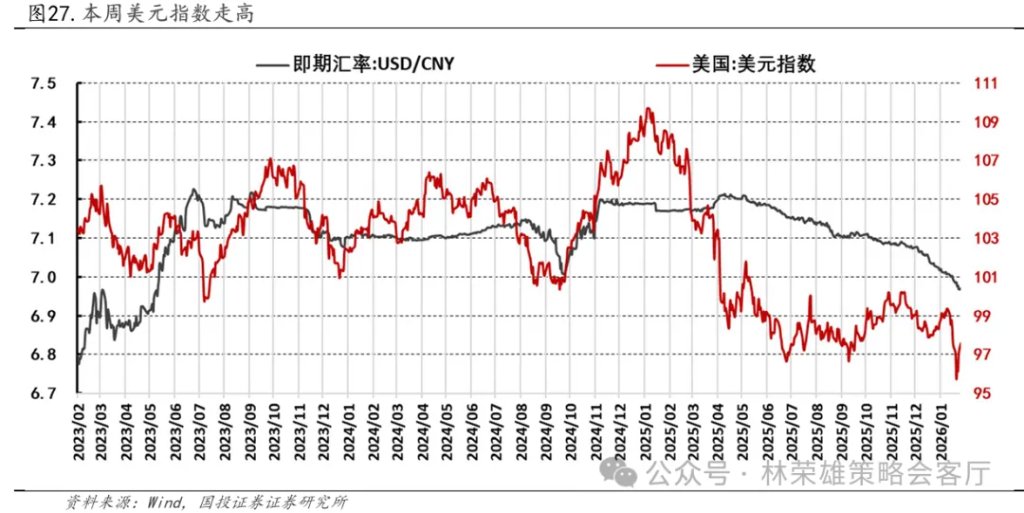
Sixth, the recent continuous appreciation of the RMB exchange rate has attracted significant market attention: Following the Christmas holidays, the US dollar index weakened further, falling below 98 points, and the offshore RMB exchange rate broke the "7" mark again after a year (the last time being during the "924" market rally in 2024). In fact, since December 2025, the RMB's appreciation against the US dollar has been among the highest of non-US dollar currencies. Looking at the relative trends of the US dollar index and the RMB exchange rate, after the tariff conflict erupted in April 2025, the US dollar index began to decline sharply, and the RMB exchange rate also entered an appreciation trend, albeit with a slight lag. Since September 2025, the US dollar index has stabilized and rebounded to around 99-100, while the RMB exchange rate has continued to appreciate. We believe that this round of RMB appreciation, against the backdrop of a weakening US dollar, relies more on two major changes in internal factors:
I. The central parity rate of the RMB against the US dollar has been consistently trending towards strength since September. This is both a "lagging catch-up" to the stronger-than-expected domestic economy and the sharp decline in the US dollar, and also reflects the insufficient appreciation of the RMB against the dollar in the past, which was not commensurate with the improvement in fundamentals. For a long time, the central parity rate has played a "counter-cyclical adjustment" role; that is, when there is significant depreciation pressure, the central parity rate is usually stronger than the market rate to stabilize expectations. Now, the spot exchange rate has surpassed the central parity rate, indicating that spontaneous bullish sentiment is rising rapidly, which also means that the current rate of appreciation may have exceeded the expectations of regulators.
Second, my country's stronger-than-expected export demand has strengthened the market demand for the RMB. Over the past three years, due to expectations of RMB depreciation, many export companies have accumulated huge dollar positions. In the first 11 months of 2025, my country accumulated a trade surplus of over $1 trillion. Many export companies, driven by year-end reporting needs and the need to repatriate funds, coupled with the continued unilateral strengthening of the RMB exchange rate, triggered a collective demand for foreign exchange settlement, further pushing the RMB higher. Simultaneously, since July, the recovery of the domestic capital market and the increased attractiveness of equity and bond assets have attracted foreign investment inflows and increased allocation to domestic currency assets, further boosting market confidence in the RMB. The combined effect of the capital and current account accounts has enabled the RMB to maintain strong resilience despite continued high external uncertainties.
The continued appreciation of the RMB in this round has also provided important support for the strength of the A-share market. Looking back at history, during the continuous appreciation of the RMB, such as in 2017, 2020, the end of 2022, and the fourth quarter of 2024, the A-share market has often shown strong performance.
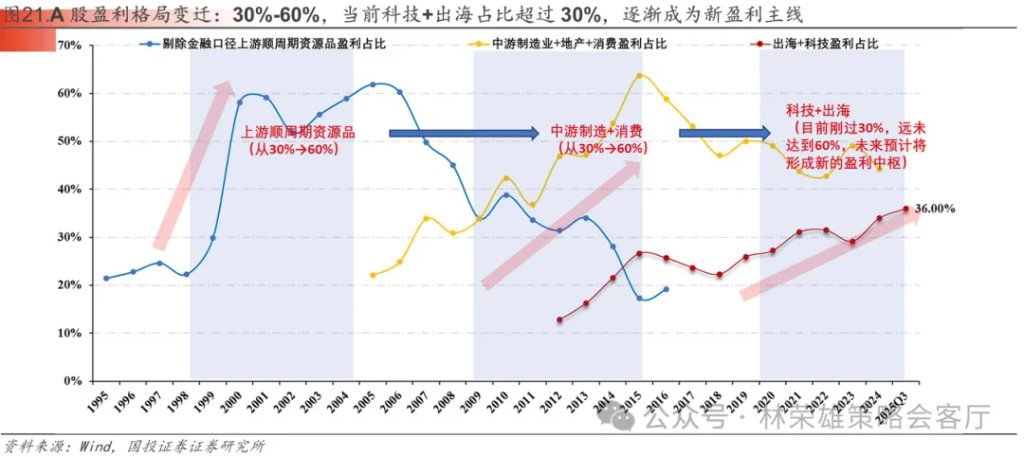
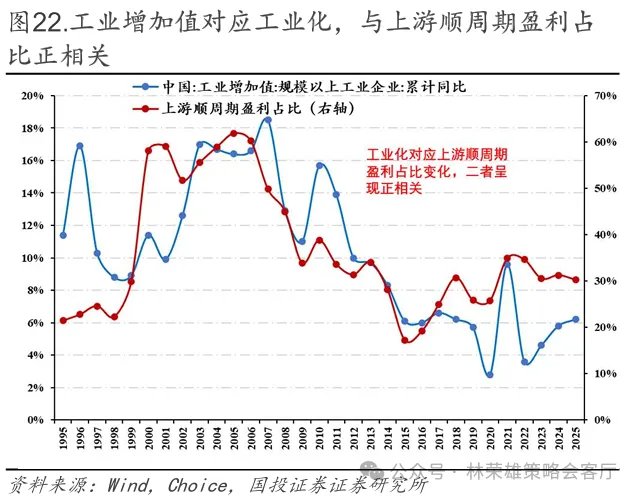
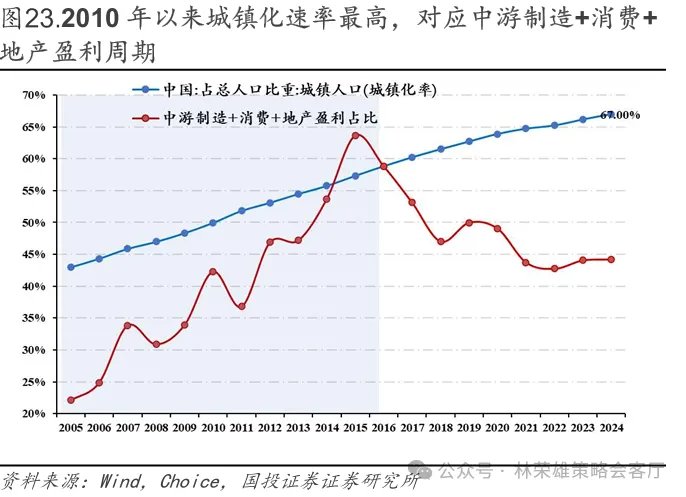
Seventh, based on observations of the long-term profit patterns of A-shares, we found that: during the period from 2000 to 2008, as China joined the WTO and began its industrialization process, the profit share of pro-cyclical resource goods (capital goods formation) increased from 30% to 60% during that wave of industrialization; during the period from 2010 to 2016, as industrialization began to shift towards urbanization, the profit share of midstream manufacturing and consumer goods + real estate (intermediate and consumer goods formation) increased from 30% to 60% during that wave of accelerated urbanization.
The most direct driving force behind this phenomenon is that each shift in the profit structure is accompanied by a rapid shift of capital expenditure towards new areas (such as strong capital expenditure during the pro-cyclical period from 2003 to 2006, the strong capital expenditure cycle of consumption, manufacturing, and real estate after 2010, and the strong capital expenditure and OFDI overseas investment in technology after 2022), which drives profit growth and ROE in these areas to exceed 15%.
Based on this, we summarize this phenomenon and believe that, according to the theory of economic development stages, as the main trend of the times develops, the corresponding sector's share of A-share (excluding financial) profits will exceed 30%, and is expected to continue to rise to 60% in the following 5-8 years, reaching a peak and becoming the core fundamental trend of this stage.
Based on observations of the A-share market's profit structure over the past two years, the technology and overseas expansion sectors have emerged as the most prominent new forces. Currently, with China's transformation from old to new growth drivers, the corresponding A-share technology and overseas expansion sectors are projected to account for over 30% of A-share profits in 2023, reaching 36% currently. Based on observations of the profit distribution patterns in A-shares during the previous industrialization to urbanization process, we tend to believe that under the major trend of "digital globalization," the profit share of technology and overseas expansion will continue to rise and approach 60% for a considerable period, becoming the two most important main themes of A-share market fundamentals.
Of particular note is the fact that as the profit landscape of A-shares is being reshaped, we believe the rising profit share of the technology and overseas expansion sectors will impact the A-share profit cycle. When the profit share of these two sectors surpasses 50%, it may propel A-share profits into a new upward cycle. In this process, given the current weak correlation between the technology and overseas expansion sectors and domestic PPI trends, this will profoundly influence the past dominance of PPI in explaining A-share fundamentals.
Furthermore, based on the financial fundamentals of A-share companies in their third-quarter reports, we make the following analysis and judgments:
1. From an overall perspective, we believe that the Q3 earnings reports basically show that the bottom of A-share earnings growth has gradually become clear. Benefiting from better-than-expected earnings from technology and overseas expansion in Q3, active trading in the financial market, and a slight rebound in PPI, on a comparable basis, the year-on-year growth rates of all A-shares and all A-shares' non-profits in Q3 2025 were 3.27% and 3.09%, respectively, a slight increase compared to 1.36% and 1.86% in H1 2025; revenue growth was 1.21% and 1.28% year-on-year, also a slight increase compared to 0.03% and 0.47% in H1; and ROE was 7.65% and 6.07%, a slight increase compared to 7.45% and 5.82% in H1 2025.
Meanwhile, with improvements in the two core indicators of free cash flow and net profit margin, the total monthly net profit margin (TTM) of all A-shares and all A-shares in Q3 2025 was 8.18% and 4.39%, respectively, up 0.44 percentage points and 0.22 percentage points compared to Q1 2025. The ratio of operating cash flow to operating revenue of all A-shares in Q3 rose to 25.34%, reflecting that the "involution" phenomenon and cash flow status of enterprises in Q3 have improved.
In summary, judging the bottom of A-share earnings is largely done by observing the relationship between PPI and earnings growth, while also considering the inflection point of ROE (TTM) in conjunction with the inventory cycle. Currently, PPI shows signs of stabilizing, the inventory cycle is in the late stage of destocking, and the bottom of A-share earnings growth is gradually becoming clear.
2. From a structural perspective, we believe that the AI industry chain, overseas expansion, and rising prices of resource commodities remain the core growth drivers.
1) Benefiting from the industrial wave brought about by AI, the performance of the technology TMT sector has been significantly released. The electronics sector (profit growth rate of +37.40% in Q3 2025, the same below) has accelerated further compared with the previous quarter. In the communications sector, the performance of communication equipment optical modules (+73.23%) continues to release high growth, and the performance of media and computer sectors has recovered.
2) Overseas expansion has shown some divergence, but it remains a sector with a high degree of performance realization. For example, home appliances (+14.36%), machinery and equipment (+14.15%, mainly construction machinery), and buses and commercial vehicles (+44.92%) have maintained relatively steady growth.
3) Cyclical commodities benefited from the rise in global pricing resource prices. Non-ferrous metals (+36.66%) led the gains due to the continuous price increase, while steel saw a partial performance reversal, and coal and petroleum petrochemicals remained at the bottom overall.
3. From the perspective of sectors and core indices, we can see that: Q3 sector profitability improved sequentially, with the ChiNext (+18.84%) showing the fastest profit growth, while the others maintained stable growth; in terms of mainstream indices, the large-cap index still outperformed the small-cap index, with the ChiNext index currently leading, ranked as follows: ChiNext (+19.28%) > CSI 500 (+9.33%) > CSI 300 (+5.23%) > CSI 1000 (-2.08%).
4. From the perspective of profitability and valuation matching: construction machinery, home appliances, gaming, lithium batteries, and chemicals have strong cost performance.
1) Secondary industries with relatively good cost-performance ratios based on PEG ratios mainly include: gaming, wind power equipment, batteries, precious metals, marine equipment, energy metals, optoelectronics, chemical fibers, construction machinery, and chemical raw materials.
2) Based on PB-ROE, the secondary industries with relatively good cost performance mainly include: white goods, construction machinery, motorcycles, aviation airports, snack foods, banking, steel, highways and railways, shipping ports, cement, etc.
Capital expenditure and ROE reflect resource allocation and profit realization, respectively, forming a core closed loop driving changes in the profit landscape. Historically, each shift in profit focus has been accompanied by a shift in capital expenditure towards new areas (such as the pro-cyclical period from 2004 to 2006, consumer manufacturing in 2010, and the rebound in TMT and OFDI overseas investment in 2024). Currently, the technology TMT+ sector and overseas direct investment have entered an upward cycle, with overseas ROE exceeding 15% and approaching 20%, mirroring the path of the pro-cyclical period, consumer manufacturing, and the recent breakthrough of ROE in the top 50 overseas investments, confirming that resources are systematically being allocated towards new growth drivers.
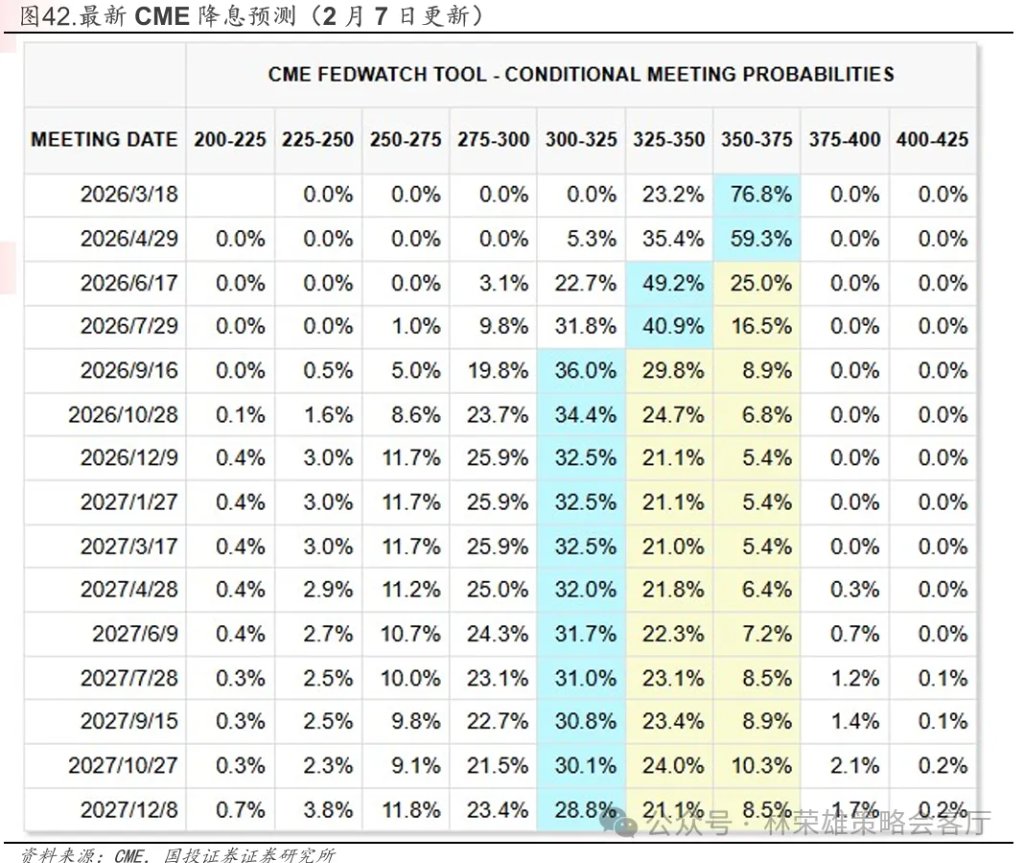
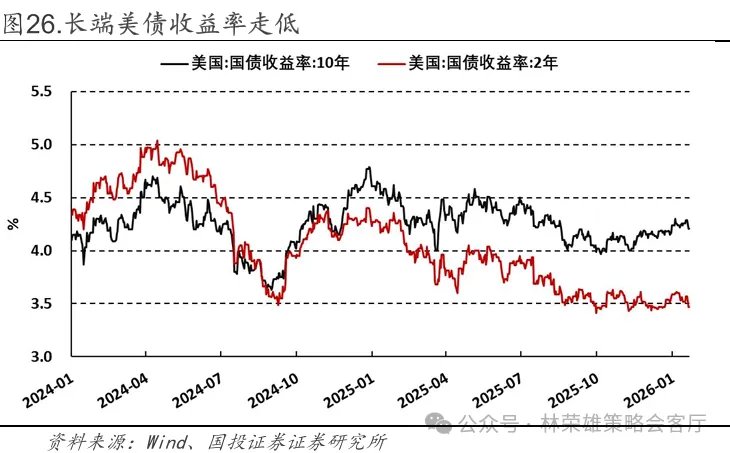
The yield on the 3-month U.S. Treasury note closed at 3.67%, unchanged from the previous week; the yield on the 10-year Treasury note closed at 4.21%, unchanged from the previous week's 4.26%. This week's changes in U.S. Treasury yields were primarily driven by two major factors: changes in policy expectations following the change in Federal Reserve personnel and weak employment data reinforcing expectations of interest rate cuts. Specifically: 1. On January 31, Trump formally nominated Kevin Warsh, a hawkish figure known for advocating balance sheet reduction, as the next Federal Reserve Chairman, sparking widespread market attention and repricing regarding a potential restructuring of the Fed's future monetary policy framework. 2. The U.S. Treasury announced it would maintain its quarterly bond issuance size, dispelling market speculation that the government might reduce long-term bond issuance to lower interest rates, providing some support for long-term rates. 3. The decline in long-term U.S. Treasury yields this week was mainly due to a sharp drop on Thursday, as a series of weak employment data, including initial jobless claims, JOLTS job openings, and Challenger layoffs, significantly strengthened market expectations that the Fed would begin cutting interest rates as early as June.
A mix of bullish and bearish factors led to divergent yields across different maturities in the US Treasury market. Market consensus held that there was no room for further rate cuts during Powell's term, resulting in flat yields for shorter-term maturities, which are more sensitive to monetary policy. However, a series of weak employment data released on Thursday significantly dampened market optimism regarding the job market, causing longer-term yields to fall that day.
The US dollar index closed at 97.61 this week, compared to 97.12 last week. The rise in the dollar index this week was mainly driven by several key news items: 1. President Trump nominated Kevin Warsh as the next Federal Reserve Chairman. The market believes he is hawkish, inclined to control the balance sheet size, and cautious about interest rate cuts, which eased market concerns about the Fed's independence and boosted the dollar. 2. Strong US economic data, particularly the unexpected expansion of the January ISM Manufacturing PMI to its highest level since 2022, eased market concerns about an economic slowdown. The producer price index also rose more than expected, weakening market expectations that the Fed will cut interest rates soon. 3. The US Senate's advancement of a government funding bill, avoiding a shutdown, and safe-haven demand triggered by political uncertainty in Europe, also provided additional support for the dollar.
From a trend analysis perspective, the rise in the US dollar index reflects a repricing process in the market amidst the interplay of bullish and bearish factors. On one hand, the hawkish nomination of the Fed chair and strong economic data significantly delayed the market's expected timing of the first rate cut, which is the core logic supporting the dollar's strength. On the other hand, weak employment data released later this week also temporarily suppressed the dollar's upward momentum. This interplay of bullish and bearish factors resulted in the dollar index exhibiting a high-level consolidation pattern, failing to form a unidirectional trend. Overall, the dollar's strength is not due to strong expectations in one direction, but rather a result of the market temporarily tilting towards "postponing rate cuts" in its debate over "when to cut rates," while external factors also provided temporary support for the dollar.
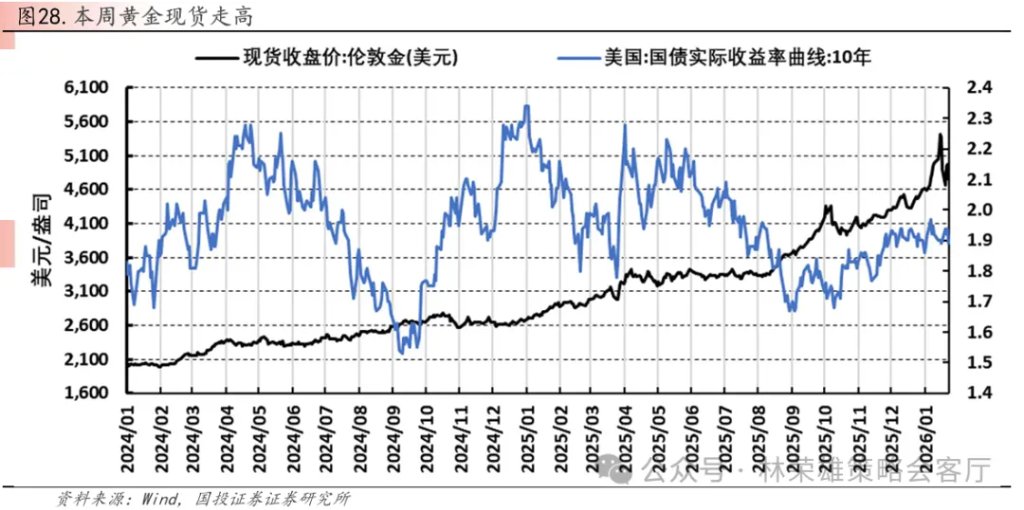
The latest spot price of gold in London is $4966.61 per ounce, compared to $4895.12 per ounce last week. The latest price of COMEX gold futures is $4988.60 per ounce, compared to $4907.50 per ounce last week. Gold prices rebounded from their lows this week, mainly due to the recovery of market sentiment after a historic plunge. The fundamental reason was the concentrated outbreak of multiple negative factors at the beginning of the week, triggering a liquidity crisis: First, Trump's nomination of Kevin Warsh as the next Federal Reserve Chairman was interpreted by the market as a hawkish signal, fueling concerns about tightening liquidity, which directly reversed the core logic supporting the previous rise in gold prices. Second, extremely crowded long positions triggered a technical sell-off; after the rapid rise in gold prices, huge profits had accumulated, making the market extremely vulnerable. Third, the exchange's increase in trading margin was a key trigger, leading to the forced liquidation of a large number of highly leveraged speculative funds due to their inability to replenish margin. These factors combined to cause the "epic plunge" in the precious metals market at the end of January and beginning of February, providing room for the rebound in the latter half of this week.
From a trend analysis perspective, gold this week showed a pattern of "corrective rebound after a sharp drop".The sharp drop at the beginning of the week was a forced liquidation of excessive speculation and high leverage, quickly releasing market panic and selling pressure. Subsequently, after hitting a temporary low, gold prices attracted some long-term investment funds. Overall, this major shock marks a shift in the market from a sentiment-driven, one-sided upward trend back to high-volatility, sideways movement. Short-term trends will be dominated by uncertainties such as personnel changes at the Federal Reserve, while the long-term price center will remain supported by macroeconomic structural factors.
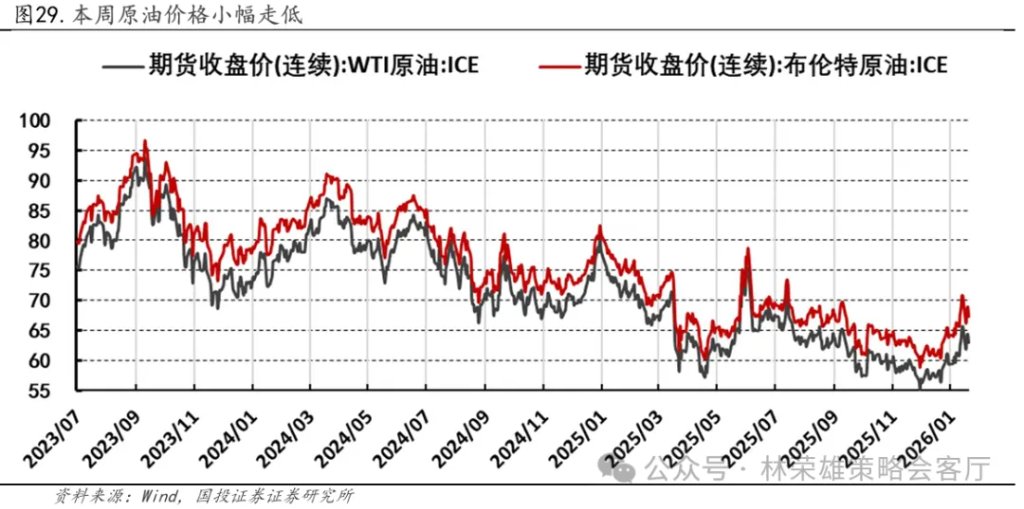
WTI crude oil closed at $63.51 per barrel this week, compared to $65.66 per barrel last week. IPE Brent crude closed at $68.05 per barrel this week, compared to $70.70 per barrel last week. The decline in crude oil prices this week was mainly due to a significant fading of geopolitical risk premiums, financial pressure from a stronger dollar, and the contagion effect of a broad sell-off in commodities. Specifically: 1. News at the beginning of the week that Iran and the United States would resume high-level nuclear talks in Turkey this Friday significantly eased extreme market concerns about a potential conflict in the Middle East leading to disruptions in oil supply, quickly squeezing out the previously accumulated geopolitical risk premiums. 2. The dollar index strengthened due to the nomination of a hawkish Federal Reserve chairman, making dollar-denominated crude oil more expensive for holders of other currencies, suppressing demand. 3. The historic plunge in gold and other precious metals at the beginning of the week triggered widespread safe-haven selling and liquidity shortages across commodity categories, impacting oil prices.
This week's decline in oil prices reflects the market's repricing from geopolitical risks to fundamentals. The previous rise in oil prices was primarily driven by the single sentiment of US-Iran tensions, and this sentiment premium was quickly reversed when signs of negotiations emerged. Although OPEC+'s production cuts provided a floor for oil prices, they could not offset the short-term reversal in sentiment.
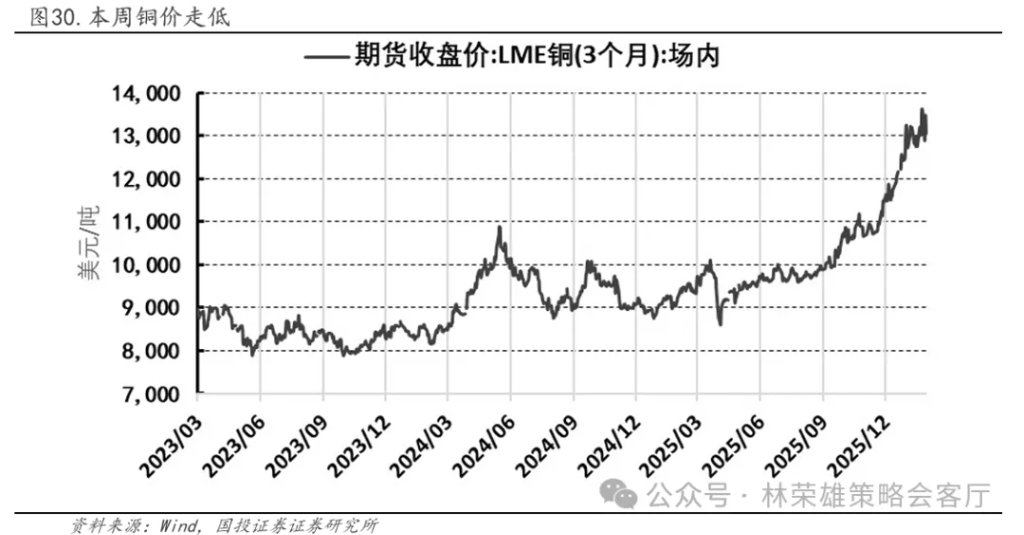
LME copper closed at $12,994.00/ton this week, compared to $13,157.50/ton last week. The decline in LME copper prices this week was mainly due to a combination of negative factors: 1. The US dollar index strengthened due to the hawkish nomination of the Federal Reserve Chairman, making dollar-denominated copper more expensive for buyers holding other currencies, thus suppressing demand and prices. 2. After copper prices hit record highs, large-scale profit-taking by speculative funds occurred in the market, while global exchange copper inventories continued to increase significantly, indicating that physical supply was not tight, weakening market expectations of a supply gap and becoming a key factor suppressing prices. 3. The historic plunge in gold and other precious metals at the beginning of the week triggered safe-haven selling across commodity categories, amplifying volatility and selling pressure in the copper market.
This week's pullback in copper prices is a technical correction following a retreat from speculative fervor. The previous surge in copper prices was primarily driven by financial speculative funds and was significantly detached from current fundamentals.When the US dollar strengthened and speculative funds in China generally chose to exit the market for safe haven before the Spring Festival, the market quickly shifted its focus from the energy transition narrative to examining current fundamentals, leading to a rapid price decline. This is not a fundamental reversal of the bull market, but rather a rational correction of the previous speculative surge. We believe the market is squeezing out the bubble and awaiting new, more solid demand signals.
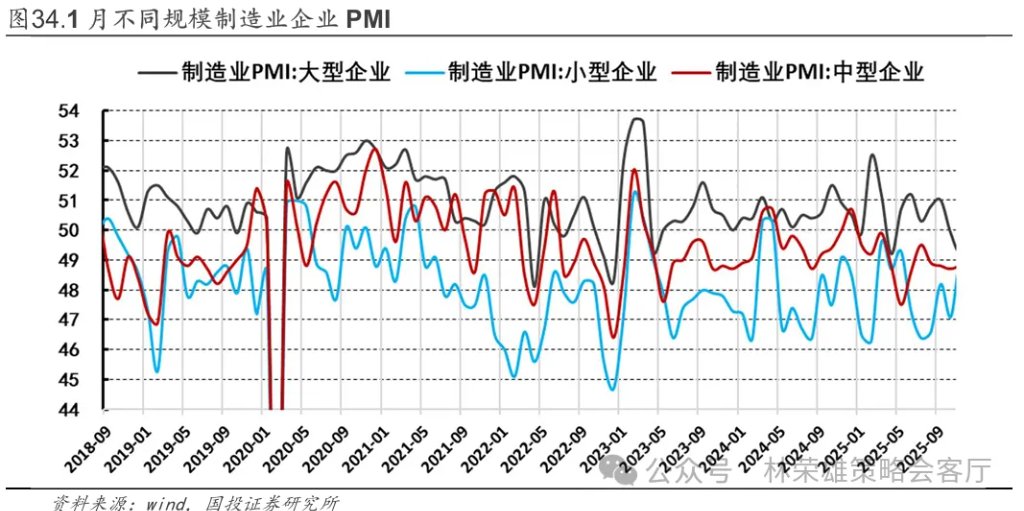
2. Internal factors: The turnaround of industrial enterprise profits from negative to positive in 2025 suggests that the bottom of profitability is approaching, but the PMI indicates that the foundation for demand recovery is still not solid.
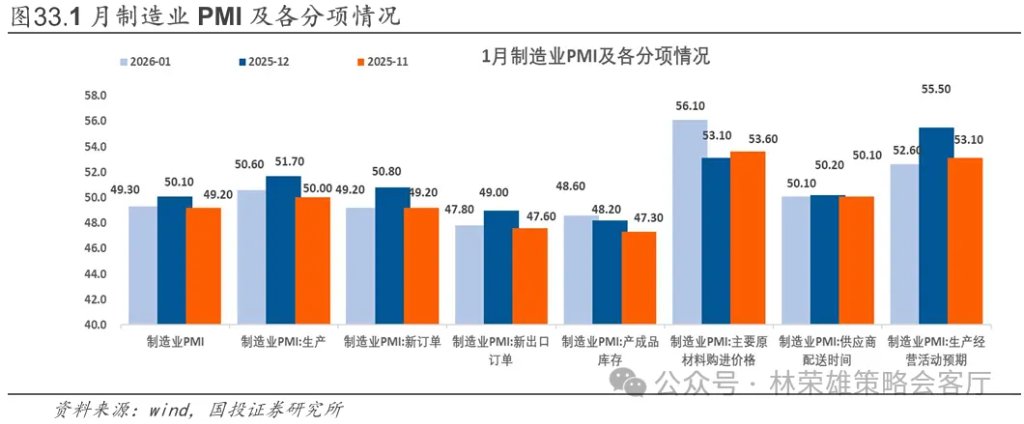
The recently released December industrial enterprise profits and January PMI data reveal several key factors. December industrial enterprise profits saw a significant rebound at the end of the year, turning positive year-on-year (+5.3%), but revenue experienced negative growth (-3.2%), indicating that profit improvement primarily relied on cost reduction and efficiency improvement, investment returns, and the low base effect, rather than a substantial recovery in end-user demand. The January manufacturing PMI fell to 49.3%, with both the production index (50.6%) and the new orders index (49.2%) declining. While the approaching Spring Festival leading to a slow season for some industries is an objective factor, the new orders index falling below the expansion/contraction threshold, and its decline (-1.6 percentage points) exceeding that of the production index (-1.1 percentage points), indicates that demand contraction outpaced production adjustments. Overall, the projected return of industrial enterprise profits to positive territory by 2025, reversing three consecutive years of negative growth, suggests that the bottom for profitability is near. However, the PMI data indicates that the foundation for demand recovery remains weak, and insufficient demand is an objective fact. The data is expected to continue to fluctuate in February due to the Spring Festival holiday. The real verification period will come in March when orders recover after work resumes. Specifically:
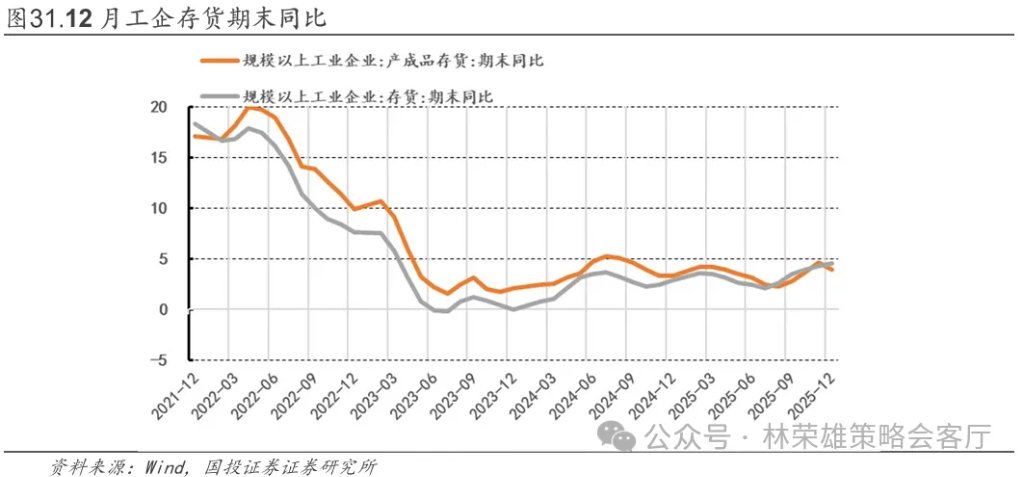
In 2025, the total profits of industrial enterprises above designated size reached 7.40 trillion yuan, a year-on-year increase of 0.6%, marking a turnaround from weak to stable profits for the year and achieving a positive return after three consecutive years of negative growth. Looking at the year's volume, price, and cost constraints: annual operating revenue reached 139.20 trillion yuan, a year-on-year increase of 1.1%, while operating costs reached 118.75 trillion yuan, a year-on-year increase of 1.3%, resulting in a slight decrease in the profit margin to 5.31%, indicating limited revenue elasticity and persistent cost stickiness. Structurally, the equipment manufacturing and high-tech manufacturing industries saw annual profit growth of 7.7% and 13.3% respectively, driven by the railway, shipbuilding, aerospace, electronics, and semiconductor industry chains, providing stronger support for profits. This suggests that profit recovery is more concentrated in new growth drivers and the midstream prosperity chain. Meanwhile, corporate cash flow and inventory constraints have not disappeared: accounts receivable at the end of December increased by 4.7% year-on-year, and finished goods inventory increased by 3.9% year-on-year. The lengthening collection cycle and continued pressure to reduce inventory mean that the sustainability of profit recovery requires further improvement on the revenue side and a continued narrowing of the cost gap. Overall, the turnaround in profits in December is a positive sign, but the focus remains on whether the recovery in orders and prices in the first quarter can continue, and whether the "anti-involution" and the recovery in demand can spread the profit improvement from structural to a wider range of industries.
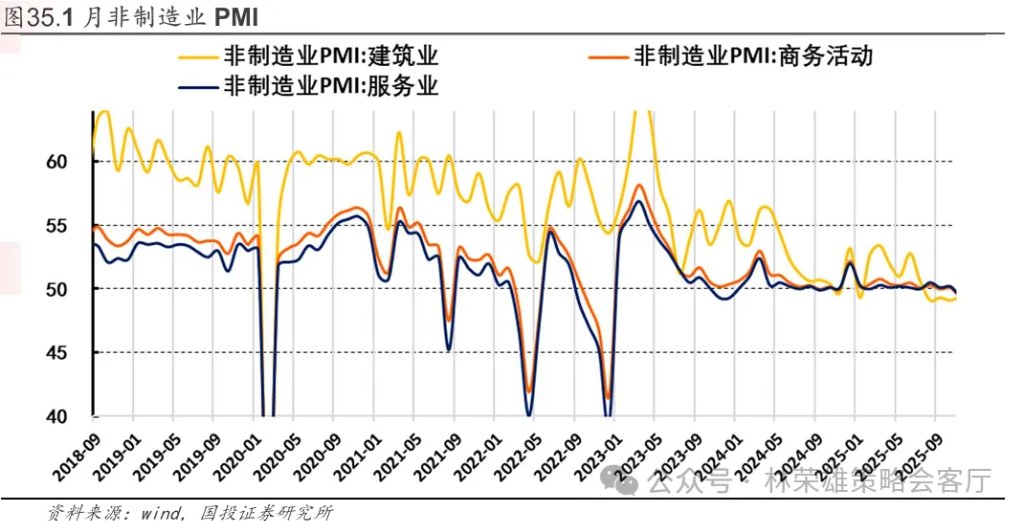
The January PMI decline after a counter-seasonal surge in December was not unexpected. The manufacturing PMI fell 0.8 percentage points to 49.3%, mainly due to supply-side constraints caused by the Spring Festival holiday and statistical factors, while demand remained weak, making order recovery more difficult: the production index, although still in expansion territory, had marginally declined by 1.1 percentage points to 50.6%, the new orders index fell to 49.2%, and new export orders also fell to 47.8%. This was partly due to the pre-emptive effect of order rushing and production in December, and partly due to insufficient domestic demand momentum amid weak real estate sales and durable goods consumption. Industry differentiation remained significant, with high-tech manufacturing and equipment manufacturing showing relatively stronger resilience; the SME index saw a larger decline than that of large enterprises, indicating a structural divergence in economic recovery. In the non-manufacturing sector, the construction PMI fell sharply to 48.8%, with new orders showing a significant drop, indicating that infrastructure construction was more significantly affected by the return of migrant workers and winter construction conditions; the services PMI only declined slightly to 49.5%, with retail and catering sectors relatively resilient thanks to pre-holiday consumption. It is worth noting that the price sub-indices have undergone phased changes, with the ex-factory price index rising to 50.6% and the raw material purchase price index rising to 56.1%, returning to expansion territory after a relatively long period, driven by rising commodity and metal prices. Overall, the later-than-usual Spring Festival may continue to affect the readings for January and February, and more attention should be paid to the resumption of work and order recovery after the holiday.
3. External factors: The manufacturing PMI unexpectedly strengthened, but inflation in the service sector remained stubborn; employment was weak, but wages were firm; the Federal Reserve is cautious about its future interest rate cut path.
3.1. The Dual Themes of Monetary Policy Divergence and Geopolitical Games
The recent policy shift by the Federal Reserve has coincided with the delicate phase of US-Iran negotiations. On the one hand, public disagreements within the Fed regarding the interest rate path have caused market expectations for liquidity to fluctuate between hawkish and dovish stances. On the other hand, the complex interaction between the US and Iran, characterized by both negotiations and ongoing conflict, continues to inject uncertainty into energy supply and geopolitical risk premiums. These two main factors together constitute key variables influencing short-term asset price fluctuations and medium- to long-term asset allocation logic.
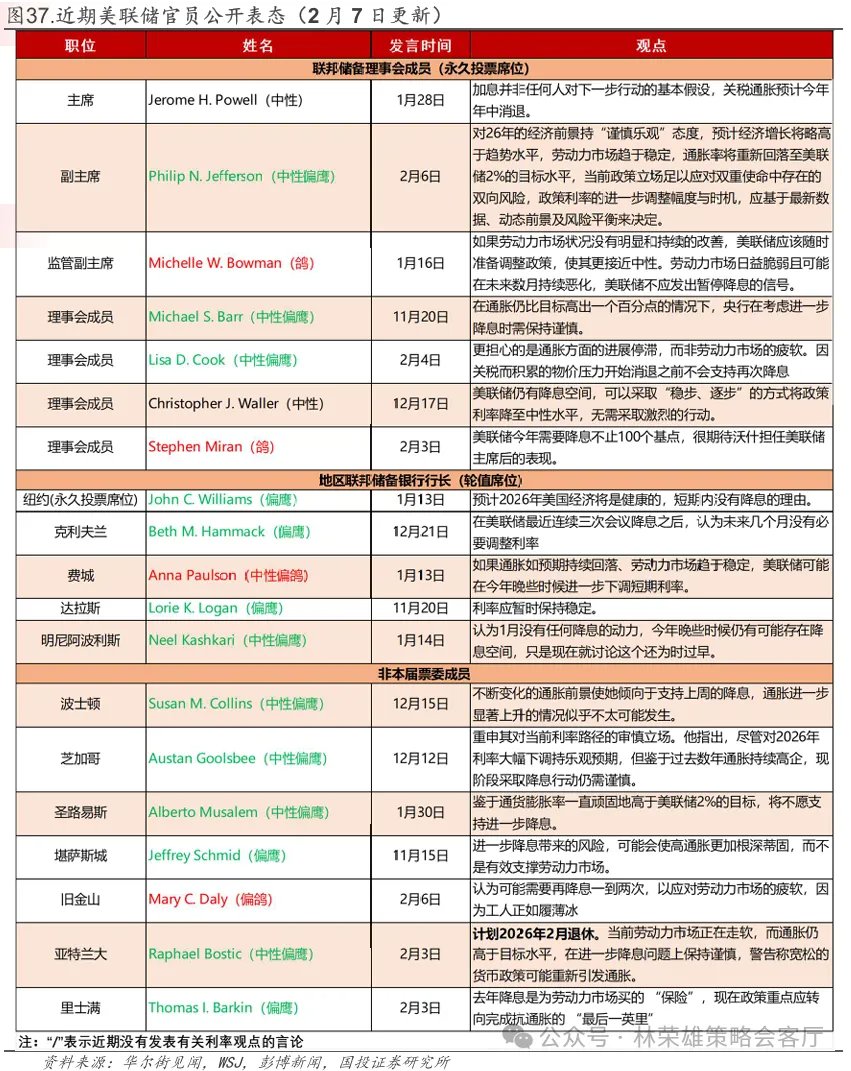
Since the January FOMC meeting, the latest statements from Federal Reserve officials have revealed significant internal divisions within a generally "cautiously optimistic" tone. Vice Chairman Philip Jefferson set the tone on February 6th, adopting a "cautiously optimistic" stance on the economic outlook and stating that the current policy position is "sufficient to address" risks, emphasizing that future adjustments will be entirely "based on the latest data." However, officials differ on the specific path forward: one side is more focused on the "last mile" of combating inflation; for example, Governor Lisa Cook is more concerned about stagnant inflation and explicitly stated that she does not support rate cuts until tariff-induced price pressures subside, while Richmond Fed President Thomas Barkin also stressed that the policy focus should shift to completing the task of combating inflation. The other side is more focused on preventing downside risks to the economy; Governor Stephen Milan advocates for rate cuts "more than 100 basis points" this year, and San Francisco Fed President Mary Day also stated that one or two more rate cuts may be needed to address the weak labor market. Despite these differences, "patience" and "data-driven decision-making" have become a general consensus, indicating that the future interest rate path will remain highly flexible and closely linked to subsequent economic data performance.
The divergence in statements from Federal Reserve officials is not simply a matter of opposing stances, but rather a form of "strategic ambiguity" by the Fed in the face of complex data signals. Its fundamental purpose is to preserve maximum policy flexibility to respond to different possible scenarios. This deliberately maintained divergence in expectations can amplify market reactions to single data points, thereby exacerbating short-term volatility. Strategically, this means that simple "easing trades" or "tightening trades" may face risks in both directions, requiring a greater emphasis on a "dumbbell-shaped" portfolio structure to mitigate the impact of fluctuating expectations.
In the past week, US-Iran relations have presented a highly complex picture of simultaneous negotiations and pressure. On February 5, under the mediation of Oman, US and Iranian officials held their first indirect meeting on the Iranian nuclear issue in Muscat since June of last year. Iranian Foreign Minister Araqchi described the meeting as having a "good start" and agreed to continue negotiations. However, symbolically, on the very same day the talks concluded, the US State Department immediately announced a new round of severe sanctions against Iran, targeting 15 entities, 14 oil tankers, and 2 individuals, aimed at cracking down on Iran's "shadow fleet" used to circumvent sanctions and obtain oil revenues. This move blatantly demonstrates the typical tactics of the US in advancing its "maximum pressure" strategy: opening a window for diplomatic contact while simultaneously using maximum pressure to strengthen its negotiating leverage. This tense situation stems directly from the rapidly escalating regional confrontation in late January: the US deployed a carrier strike group to the Middle East and openly threatened to consider a "major strike" against Iran, while Iran responded that it was "200%" prepared for self-defense. Against this backdrop, Middle Eastern countries such as Turkey, Egypt, and Qatar launched intensive diplomatic efforts, calling on both sides to de-escalate the situation and creating conditions for the upcoming talks in Oman. On February 6, the White House issued a statement saying that US President Trump had signed an executive order that day imposing tariffs on countries trading with Iran. On the same day, Trump stated that the US would resume negotiations with Iran the following week.
The scenario of "simultaneous negotiations and sanctions" between the US and Iran has far greater implications than a single geopolitical event.This pattern makes it difficult to fundamentally ease regional tensions, but it also blocks the extreme risk of full-blown conflict. For the market, the direct consequence is that the risk premium for crude oil will become sticky. More importantly, this game affects the global energy supply landscape, and if it continues to fluctuate, it may slow the decline in global inflation, thereby indirectly constraining the policy space of major central banks such as the Federal Reserve, forming a potential transmission chain of "geopolitics → energy prices → inflation expectations → monetary policy".
3.2. The US January ISM PMI for manufacturing rebounded more than expected, while inflation in the service sector remained resilient.
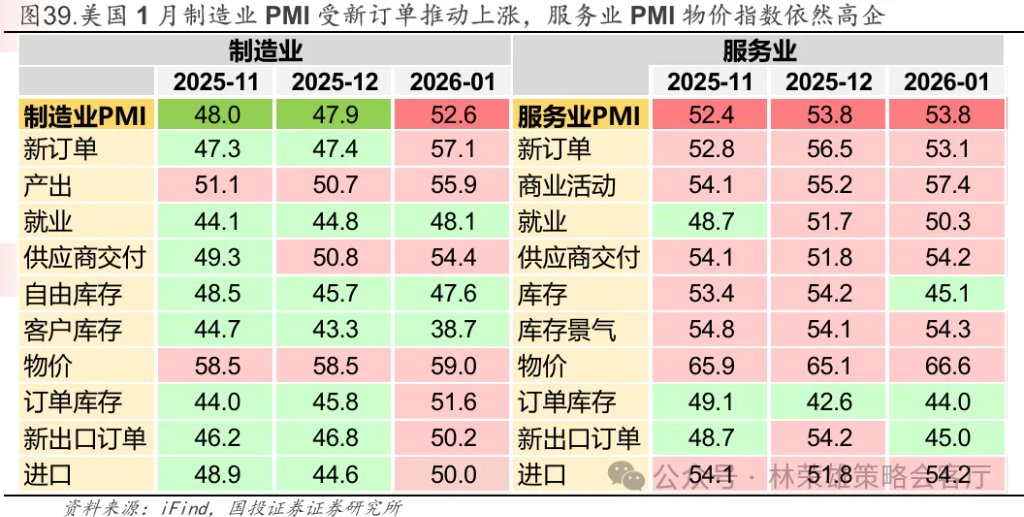
On Monday, February 2nd (US time), the ISM released the US Manufacturing PMI for January 2026. Data showed that the US Manufacturing PMI for January was 52.6, a significant increase from the previous value of 47.9 and far exceeding the expected 48.5. Looking at the sub-indices, the output index expanded sharply to 55.9, up from 50.7 in the previous month; the new orders index was 57.1, up 9.7 points from 47.4 in the previous month; and the new export orders index rose to 50.2, up from 46.8 in the previous month.
According to the chairman of the ISM Manufacturing Business Survey Committee, US manufacturing activity returned to expansion territory in January, with all five sub-indices of the PMI (new orders, production, employment, supplier deliveries, and inventories) improving compared to the previous period. However, the employment and inventory indices remained in contraction. On the demand side, new orders, order backlog, and new export orders all expanded, while the customer inventory index remained in the "too low" range and contracted at an accelerated pace, which is generally considered a positive signal for future production. However, some commentators pointed out that January is a restocking month after the holidays, and some purchases may have stemmed from companies stockpiling in anticipation of tariff increases. On the output side, the production index expanded for the third consecutive month; the employment index, while still contracting, improved by 3.3 percentage points from the previous month. However, 66% of surveyed companies indicated that their current headcount remained stable and they had not increased hiring. Input indicators showed mixed performance: the supplier deliveries index showed a slowdown in delivery speed, the inventory index continued to contract, while the price index continued to rise. Among the six major manufacturing sectors, transportation equipment, machinery, chemical products, food, beverage and tobacco products, and computer and electronic products all expanded in January.
On Wednesday, February 4th (US time), the ISM released the US Services PMI for January 2026. Data showed that the US Services PMI for January was 53.8, unchanged from the previous month but higher than expected. Looking at the sub-indices, the Business Activity Index rose to 57.4, from 55.2 previously. The New Orders Index fell 3.4 to 53.1. The Employment Index fell slightly to 50.3, from 51.7 previously. The Price Index continued to rise to 66.6, from 65.1 previously. Notably, inventories fell sharply by 9.1 to 45.1, while new export orders fell sharply by 9.2 to 45.0.
According to the chairman of the ISM Manufacturing Business Survey Committee, the Services PMI in January saw all four sub-indices remain in expansion territory for the second consecutive month, similar to December 2024. The readings over the past two months have averaged 0.7 percentage points higher year-on-year, indicating continued expansionary momentum. The employment index rose for the second consecutive month, the first time since early 2025, another positive sign. However, the closely watched price index continues its slow rise, currently 0.2 percentage points above its 12-month seasonally adjusted average (66.4%). Meanwhile, more respondents mentioned the impact of tariffs and uncertainty in January, likely related to the annual contract renewal period and geopolitical tensions; however, gasoline and diesel prices remained among the declining commodities. Notably, the business activity and supplier delivery indices have risen to their highest levels since October 2024, indicating stronger business activity and slower supplier deliveries. Whether prices will continue or rise further remains to be seen.
January's US ISM PMI data reveals a stronger-than-expected rebound in the manufacturing sector, driven by demand, while the service sector, while continuing its expansion, exposed persistent inflationary pressures and fluctuations in external demand. The surge in the manufacturing PMI was primarily driven by an explosive increase in new orders, coupled with customer inventories remaining in the "too low" range. However, the employment sub-index remained contractionary, and companies showed cautious hiring intentions, indicating limited employment transmission effects in the early stages of this rebound. Its sustainability is also hampered by seasonal restocking and pre-emptive purchases due to tariff expectations, requiring further data verification. The stable high level of the services PMI shows the resilience of the economy, but the further rise in price indices and frequent mentions of tariff uncertainty by respondents indicate that inflation stickiness in the service sector remains. In summary, this data reduces the urgency of a short-term economic slowdown for a "soft landing" narrative, but the inflationary resilience of the service sector directly constrains the scope for monetary policy easing. The Fed's data-dependent stance will now primarily focus on discerning the sustainability of the manufacturing rebound and the true direction of price pressures in the service sector.
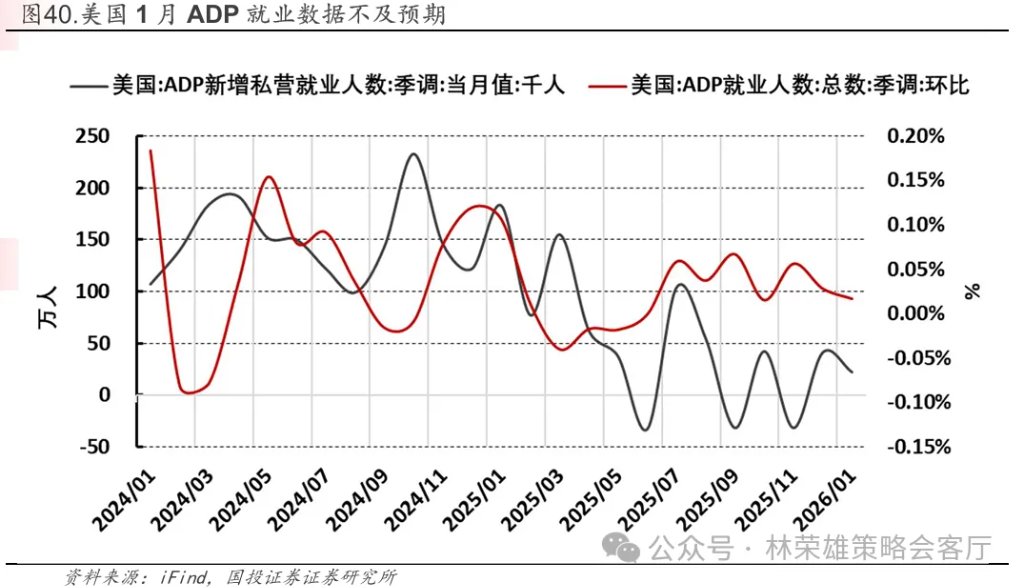
3.3. US ADP employment growth slowed significantly in January, while stable wage growth highlighted structural contradictions in the market.
On Wednesday, February 4th, data released by the ADP Research Institute in collaboration with the Stanford Digital Economy Lab showed that U.S. ADP employment increased by 22,000 in January, lower than the expected increase of 45,000 and the previous month's 41,000. Breaking it down, goods-producing sector employment increased by 1,000, with manufacturing cutting 8,000 jobs, construction adding 9,000, and mining remaining unchanged. Service sector employment increased by 21,000 overall, but education and health services added 74,000, while professional and business services saw a significant cut of 57,000. Furthermore, on Thursday, February 5th, the U.S. Bureau of Labor Statistics released data showing that U.S. JOLTS job openings in December were 6.542 million, the lowest level since September 2020, compared to an expected 7.25 million and a revised 6.928 million for November (up from 7.146 million). Initial jobless claims in the U.S. last week were 231,000, compared to an estimated 212,000 and a previous week's 209,000. The number of Americans continuing to claim unemployment benefits in the week ending January 24 was 1.844 million, compared to an estimated 1.85 million.
January's ADP employment data, which fell far short of expectations, showed that the US labor market momentum weakened further at the start of the year. Weak overall job growth, driven entirely by education and healthcare services, confirms the extremely high and unbalanced industry concentration of economic momentum. Contractions in employment across several key sectors, including professional and business services and manufacturing, coupled with net layoffs by large corporations, suggest that corporate capital expenditures and business confidence may be becoming more cautious. However, while job growth is so sluggish, wage growth remains stable at a high 4.5%. This contradictory combination could indicate that productivity gains are insufficient to offset labor cost pressures, or it could reflect a stalemate of "low hiring, low layoffs," where companies are forced to pay a premium to retain existing employees. Either way, it means that the core source of inflationary pressures in the service sector has not fundamentally eased despite the cooling of the job market. This data is a double-edged sword for the Federal Reserve: the significant slowdown in total employment undoubtedly strengthens its vigilance against the downside risks to the economy and provides a reason to consider policy easing in the future, but the stubborn wage growth and highly concentrated employment structure also mean that the risk of inflation has not completely dissipated, which may further strengthen the Fed's wait-and-see stance of "remaining patient" and "relying on more data" in the short term.