


Author:Colorful Smoke and Clouds
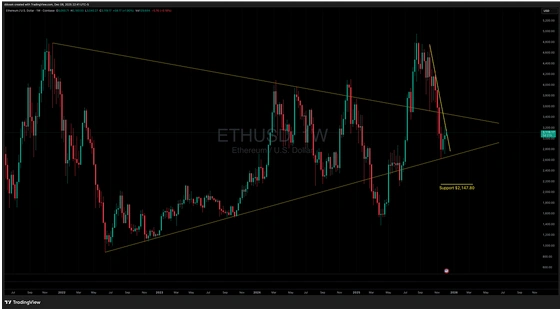
Technical analysis reveals that Ethereum (ETHUSD) remains primarily contained within a large, converging wedge pattern on the weekly chart. While price briefly broke both above and below this long-term structure in 2025, it has since settled back inside, confirming that this converging pattern dictates the macro trend.
Weekly chart
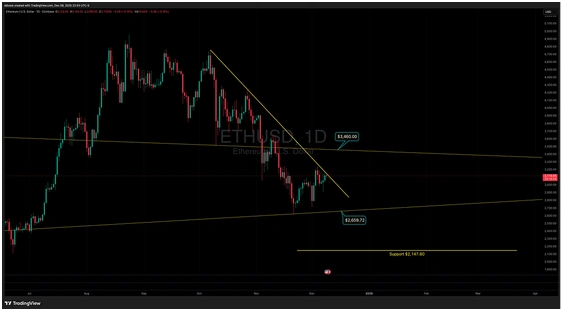
More immediately, on the daily chart, ETHUSD price has pressed directly into the declining trendline that has served as primary resistance since October. Price first approached this resistance on December 4th and has since consolidated sideways, hugging the trendline. This tight consolidation, rather than an immediate pullback, suggests strong buying pressure and implies that a decisive upside break is possible.
Normally, a collective third touch of a trendline is followed by a sharp rejection. If the bulls succeed in breaking this long-standing resistance to the upside, the next major target will be the declining trendline resistance situated near $3,460.00. A successful close above this declining trendline would signal a clear breakout from the October downtrend and confirm a strong bullish pivot.
Daily chart
The bearish scenario: Where downside risk lies
However, a rejection at this current declining trendline presents a serious downside risk for Ethereum.
A failure to break higher would likely put the coin in jeopardy of re-testing the support formed by the inclining trendline of the macro wedge pattern, which sits around $2,659.72. This level acts as a critical line in the sand.
A confirmed break below the $2,659.72 support would dramatically increase selling momentum and could easily push the price down to re-test the next established support level at $2,147.80.
Ethereum is currently sitting at a crossroads on the charts. A successful close above the current declining trendline resistance would validate the breakout thesis. A swift rejection, however, confirms the continuation of the short-term downtrend and directs price toward the lower wedge boundary.