


Login
BTC
$67,351.41
-0.99%

ETH
$1,971.59
-0.85%
USDT
$0.9992
-0.03%
XRP
$1.38
-1.60%
BNB
$600.43
-2.65%
USDC
$1.00
+0.02%

SOL
$80.30
-1.56%
TRX
$0.2773
-0.40%
WTRX
$0.2775
+0.06%
stETH
$1,969.64
-0.72%
DOGE
$0.09363
-0.67%
BCH
$529.50
+2.84%
USDS
$1
+0.02%
ADA
$0.2646
-0.86%
WSTETH
$2,407.59
-0.75%
WBTC
$67,196.59
-1.00%
HYPE
$30.56
-1.51%
WBETH
$2,150.27
-0.72%
WETH
$1,965.25
-0.94%
USDe
$0.9987
-0.01%
XMR
$341.69
+0.11%
weETH
$2,129.58
-1.35%
LINK
$8.47
-0.94%
CC
$0.1592
-4.99%
AETHUSDT
$0.9995
-0.03%
AETHWETH
$1,913.35
-3.41%
CBBTC
$67,172.21
-1.00%
DAI
$0.9998
-0.01%
USD1
$1
-0.03%
XLM
$0.1579
-2.11%
BTCB
$67,381.34
-0.70%
LTC
$53.46
+0.79%
HBAR
$0.09341
-2.19%
PYUSD
$1.00
+0.02%
ZEC
$235.98
-0.76%
AVAX
$8.90
+0.34%
sUSDe
$1.22
-0.02%
SHIB
$0.0{5}612
-1.13%
SUI
$0.9259
-0.76%
TON
$1.44
+4.43%
RAIN
$0.009896
-3.00%
CRO
$0.07696
-1.95%
WLFI
$0.1021
-5.02%
XAUT
$4,967.60
-1.72%
PAXG
$4,996.80
-1.75%
DOT
$1.28
-0.70%
UNI
$3.36
-1.84%
MNT
$0.6145
-1.41%
BFUSD
$0.9997
+0.00%
M
$1.39
-2.27%
ASTER
$0.72
-0.41%
AAVE
$112.73
+2.44%
TAO
$157.60
+0.19%
BGB
$2.35
-1.92%
USDf
$0.9968
+0.01%
OKB
$75.60
+0.20%
USDG
$1.00
+0.02%
syrupUSDC
$1.15
-0.09%
SKY
$0.06668
-0.86%
PEPE
$0.0{5}368
-1.87%
RLUSD
$1.00
+0.04%
PI
$0.1464
+7.41%
ETC
$8.29
-0.24%
ICP
$2.30
-5.71%
NEAR
$0.98
+1.98%
ONDO
$0.2545
-0.24%
RSETH
$2,074.72
-0.91%
BTCT
$67,138.72
-0.85%
JLP
$3.58
-0.97%
WLD
$0.3852
-1.10%
KCS
$8.24
+0.38%
JITOSOL
$101.67
-1.09%
POL
$0.0958
+2.79%
USDCE
$0.999
-0.05%
ATOM
$2.03
+2.99%
USDD
$0.9993
-0.02%
ENA
$0.1164
-0.60%
BBTC
$66,435.48
-1.72%
WBNB
$600.14
-2.39%
NIGHT
$0.05145
+3.16%
KAS
$0.03118
-3.04%
USDTb
$0.9995
-0.04%
QNT
$67.63
-0.57%
ALGO
$0.0915
-0.22%
GT
$6.98
-1.25%
FLR
$0.00942
-2.99%
WFLR
$0.009401
-1.91%
RETH
$2,267.29
-1.29%
LBTC
$67,064.86
-1.48%
TRUMP
$3.33
+0.42%
MYX
$3.00
+5.72%
FBTC
$67,071.51
-1.19%
XDC
$0.03661
+0.51%
APT
$0.92
-1.81%
U
$1.00
+0.03%
BNSOL
$88.00
-1.57%
USDY
$1.11
-0.69%
PUMP
$0.001959
-0.31%
KHYPE
$31.02
-0.41%
RNDR
$1.32
-0.39%
BTC
$67,351.41
-0.99%
ETH
$1,971.59
-0.85%
USDT
$0.9992
-0.03%
XRP
$1.38
-1.60%
BNB
$600.43
-2.65%
USDC
$1.00
+0.02%
SOL
$80.30
-1.56%
TRX
$0.2773
-0.40%
WTRX
$0.2775
+0.06%
stETH
$1,969.64
-0.72%
DOGE
$0.09363
-0.67%
BCH
$529.50
+2.84%
USDS
$1
+0.02%
ADA
$0.2646
-0.86%
WSTETH
$2,407.59
-0.75%
WBTC
$67,196.59
-1.00%
HYPE
$30.56
-1.51%
WBETH
$2,150.27
-0.72%
WETH
$1,965.25
-0.94%
USDe
$0.9987
-0.01%
XMR
$341.69
+0.11%
weETH
$2,129.58
-1.35%
LINK
$8.47
-0.94%
CC
$0.1592
-4.99%
AETHUSDT
$0.9995
-0.03%
AETHWETH
$1,913.35
-3.41%
CBBTC
$67,172.21
-1.00%
DAI
$0.9998
-0.01%
USD1
$1
-0.03%
XLM
$0.1579
-2.11%
BTCB
$67,381.34
-0.70%
LTC
$53.46
+0.79%
HBAR
$0.09341
-2.19%
PYUSD
$1.00
+0.02%
ZEC
$235.98
-0.76%
AVAX
$8.90
+0.34%
sUSDe
$1.22
-0.02%
SHIB
$0.0{5}612
-1.13%
SUI
$0.9259
-0.76%
TON
$1.44
+4.43%
RAIN
$0.009896
-3.00%
CRO
$0.07696
-1.95%
WLFI
$0.1021
-5.02%
XAUT
$4,967.60
-1.72%
PAXG
$4,996.80
-1.75%
DOT
$1.28
-0.70%
UNI
$3.36
-1.84%
MNT
$0.6145
-1.41%
BFUSD
$0.9997
+0.00%
M
$1.39
-2.27%
ASTER
$0.72
-0.41%
AAVE
$112.73
+2.44%
TAO
$157.60
+0.19%
BGB
$2.35
-1.92%
USDf
$0.9968
+0.01%
OKB
$75.60
+0.20%
USDG
$1.00
+0.02%
syrupUSDC
$1.15
-0.09%
SKY
$0.06668
-0.86%
PEPE
$0.0{5}368
-1.87%
RLUSD
$1.00
+0.04%
PI
$0.1464
+7.41%
ETC
$8.29
-0.24%
ICP
$2.30
-5.71%
NEAR
$0.98
+1.98%
ONDO
$0.2545
-0.24%
RSETH
$2,074.72
-0.91%
BTCT
$67,138.72
-0.85%
JLP
$3.58
-0.97%
WLD
$0.3852
-1.10%
KCS
$8.24
+0.38%
JITOSOL
$101.67
-1.09%
POL
$0.0958
+2.79%
USDCE
$0.999
-0.05%
ATOM
$2.03
+2.99%
USDD
$0.9993
-0.02%
ENA
$0.1164
-0.60%
BBTC
$66,435.48
-1.72%
WBNB
$600.14
-2.39%
NIGHT
$0.05145
+3.16%
KAS
$0.03118
-3.04%
USDTb
$0.9995
-0.04%
QNT
$67.63
-0.57%
ALGO
$0.0915
-0.22%
GT
$6.98
-1.25%
FLR
$0.00942
-2.99%
WFLR
$0.009401
-1.91%
RETH
$2,267.29
-1.29%
LBTC
$67,064.86
-1.48%
TRUMP
$3.33
+0.42%
MYX
$3.00
+5.72%
FBTC
$67,071.51
-1.19%
XDC
$0.03661
+0.51%
APT
$0.92
-1.81%
U
$1.00
+0.03%
BNSOL
$88.00
-1.57%
USDY
$1.11
-0.69%
PUMP
$0.001959
-0.31%
KHYPE
$31.02
-0.41%
RNDR
$1.32
-0.39%
Market
/SHIB Price

SHIB
SHIB

No.38
$0.0{5}612
-1.13%
≈$0.00
Market Cap
$3.61B
Cir. Cap
$3.61B
Cir. Supply
589,243.9B
Cir. Rate
99.9565%
Total Supply
589,500.44B
Max Supply
589,552.7B
24h Volume
$21,035.31B
24h Vol (BTC)
128.64M
24h Turnover
0.03567125%
Market Share
0.15%
Performance
Low
0.00
Range
+0.04%
High
0.00
Listing
$0.00000
ATH (2020-08-27)
$0.0{4}8845
-93.08%ATL (2021-10-28)
$0.0{10}8164
+7495668.93%Official


Converter
SHIB

USD


Chart
Market
About
Ad
XBIT Invite: Earn points & commission
SHIB
SHIB
No.38
$0.0{5}612
-1.13%
≈$0.00
Price
Cap
K-line
Depth
1 Second
1 Minute
5 Minutes
1 Hour
4 Hours
1 Day
TradingView
1H
+0.49%
24H
-1.13%
7D
+0.82%
30D
-29.33%
1Y
-62.48%
All
+379.48K%


AI Assistant
SHIB下跌原因
SHIB资金流向
SHIB买卖支撑位
SHIB多空比分析
SHIB趋势分析
Ask AI

About SHIB

Bullish
Bearish
Community

TheCryptoBasic
 Follow
 414
414 0
0 0
0 49
49
TheCryptoBasic
Follow 3220024

CoinMarketCap
Follow 3750038
TheCryptoBasic
Follow 3740022
TheCryptoBasic
Follow 3460047
TheCryptoBasic
Follow 3110030
TheCryptoBasic
Follow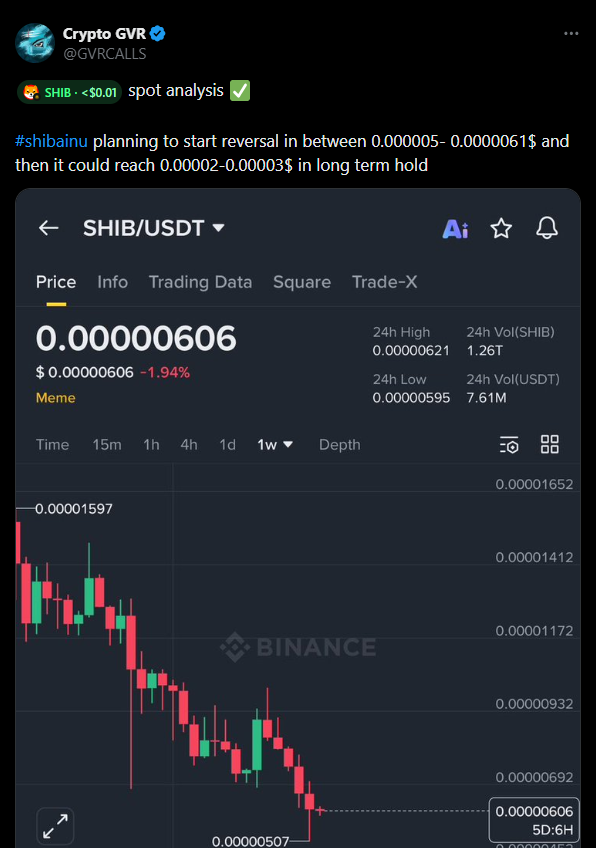 4620032
TheCryptoBasic
Follow 3180025
Anndy Lian
Follow3780030TheCryptoBasic
Follow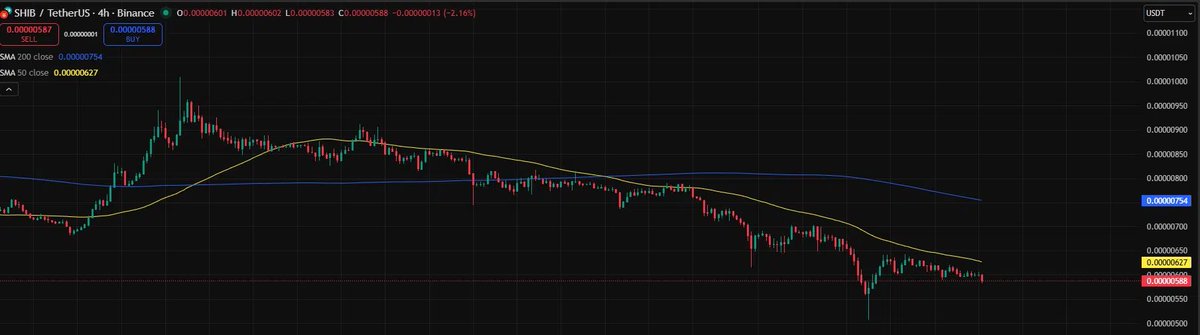 3750034